Success Criteria + Breaking Points
Introduction
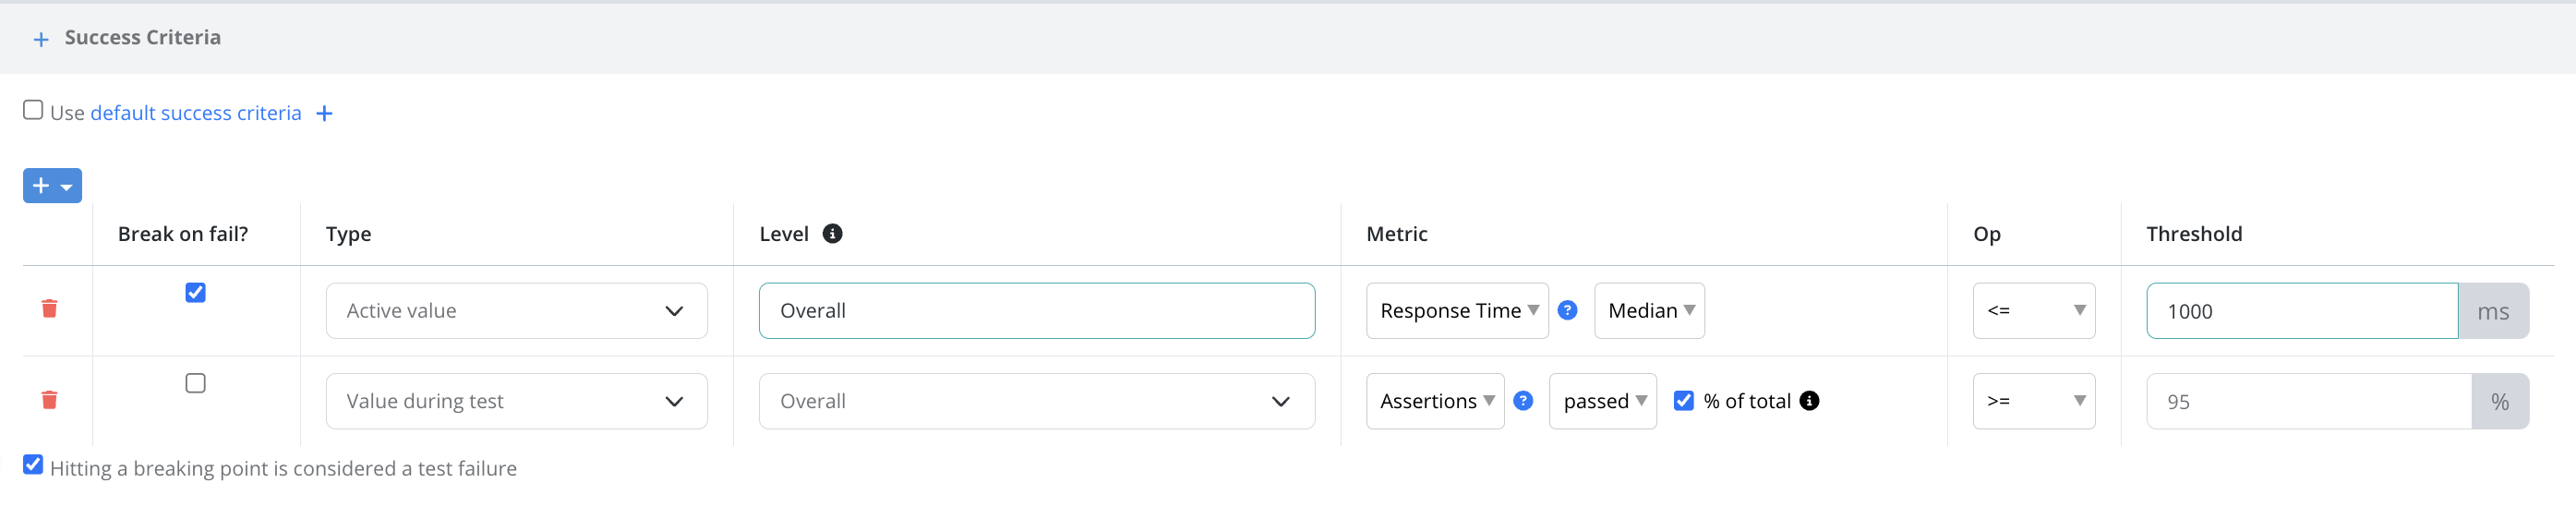
Define a set of criteria for what you consider a successful test outcome. For example: Median Response Time < 1000ms.
All criteria are evaluted when the test finishes. Criteria that are marked as “Break on fail” are setup as breaking points. These criteria are evalauted in real-time during the test and as soon as one is no longer met the test is automatically stopped.
Any metric can be used in building criteria including custom user defined metrics.
Getting Started
While creating or editing a test configuration there is a Success Criteria + Breaking Point section.
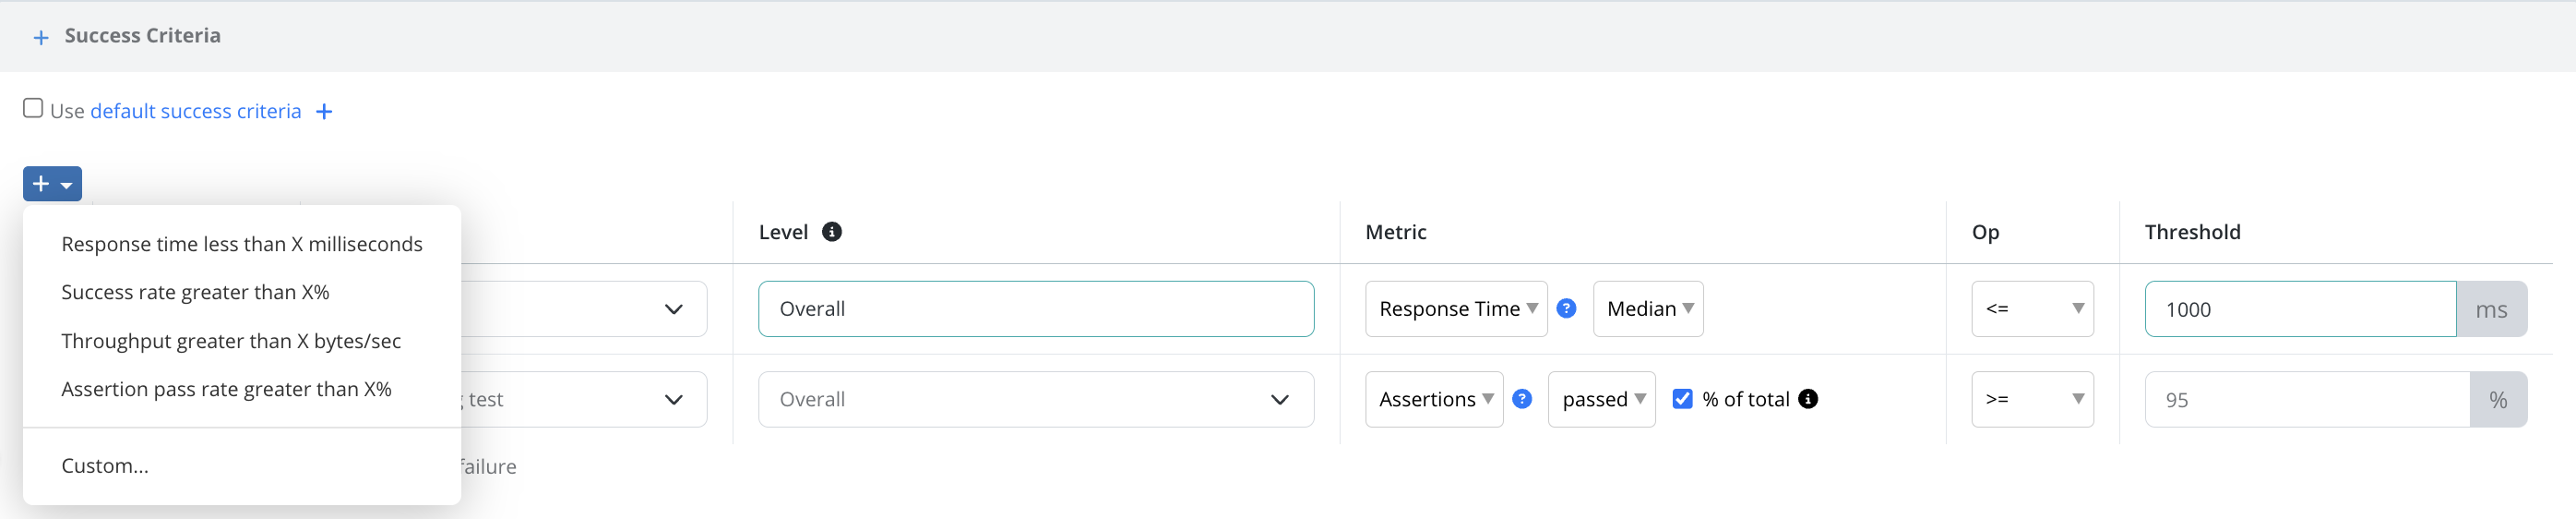
Add new criteria by selecting a common template from the dropdown or Custom… to create your own.
Where to Define
Success criteria and breaking points can be configured in two places:
- Organization wide, per scenario type: Go to Org Management => Settings => Test Related => Default Success Criteria and define the criteria for each scenario type (e.g. JMeter, Gatling, Node.js Script, Selenium, Puppeteer, Playwright, Postman, etc).
- Per test configuration: You can override the organization default criteria in a single test configuration while editing it within the Success Criteria widget. Uncheck the “Use default success criteria” checkbox to specify conf specific criteria.
General Notes
- Criteria that are set to “break on fail” are only monitored after the ramp up period of your test or after at least 1 minute.
- If your scenario is a script that creates custom metrics, the custom metrics will only be available in the dropdown while creating criteria AFTER the first execution of your test.
Levels
Success criteria can be evaluated at two levels:
- Overall: The metric value used to evaluate the success criteria is calculated across the entire test run.
- Resource: The metric value at the resource level is used to evaluate the success criteria. In terms of which resource will be used there are 3 options:
- Max: The resource that has the largest value for the chosen metric.
- Min: The resource that has the smallest value for the chosen metric.
- Specify: Choose a specific resource to use on every test run. Note that you’ll need to run the test configuration one time before the dropdown populates with the resources.
Criteria Types
There are 4 types of criteria:
- Active value (breaking points only): Monitor the value of the specified metric during the most recent minute of your test execution.
- Value during this test: Monitor the value of the specified metric across the entire test execution.
- Change minute over minute (breaking points only): Monitor the percentage change in the specified metric from the previous minute to the most recent minute of your test execution.
- Change from previous test runs: Monitor the percentage change in the specified metric from a weighted average of up to 10 recent test executions to this current test execution. If there are less than 10 test executions for your configuration, all executions are included. If this is the first execution, no breaking point of this type will be triggered.
The criteria type is applied after the level filter discussed in the previous section.
Metrics
Testable captures a bunch of standard metrics related to response time, concurrency, throughput, and success rate. All metrics are available for use in breaking points. See the metrics glossary for a more precise definition of each metric. Any custom metric is also available for monitoring.
Counters: For counter metrics (e.g. Success) you can monitor the metric itself or the metric as a percent of total requests made during the test or time interval.
Timings: For timing metrics (e.g. Response Time) several aggregations are available including percentiles, count, standard deviation, max, min, mean, and median. All these aggregators can be monitored in your criteria.
Histograms: For histograms (e.g. Http Response Code) a metric is available for each bucket and the bucket as a percent of the total sum across the all histogram buckets. So for example, you can monitor the number of 200 HTTP Response Codes or the percent of all HTTP responses that had a 200 status.