Customize Test Result View
- Introduction
- Widget Location
- Add/Remove Widget
- Add Chart
- Images Widget
- Customize Summary
- Customize By Resources Grid
- View Actions
Introduction
After executing a test a default view is shown which shows a variety of information about the test. Several other system views are available as well.
While this is a useful starting place, Testable supports deep customization to create your own results view that can be saved for later use.
Widget Location
The widgets can be reordered by clicking and dragging on the header and releasing in the newly desired location.
Add/Remove Widget
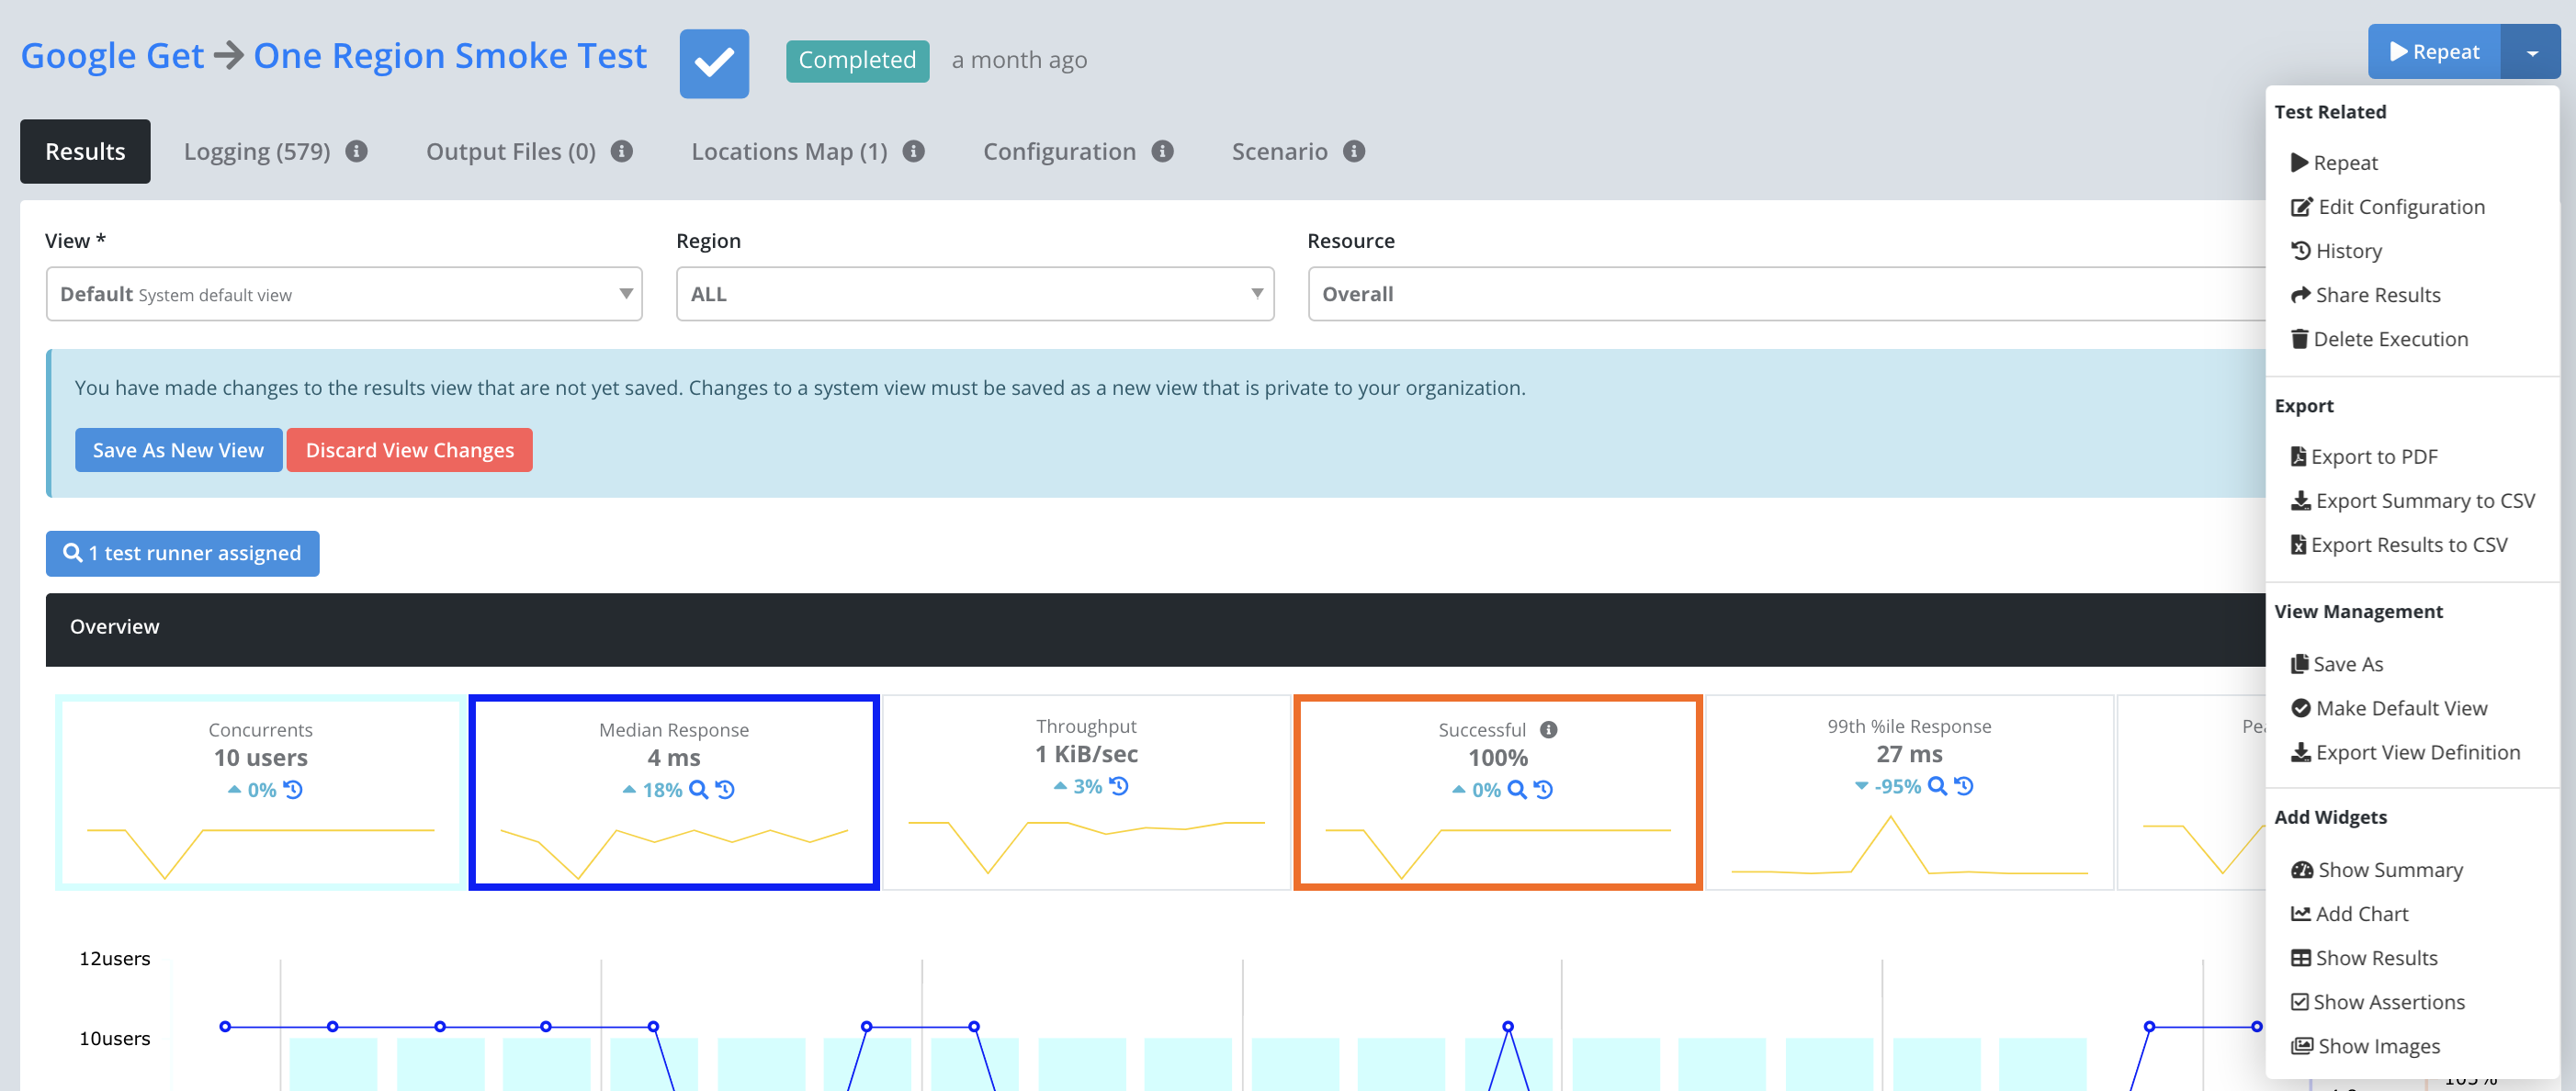
Each widget can be removed by clicking on the red ‘x’ in the upper right. To add a widget click on the drop down menu in the upper right and select the type of widget to add. Note that the images, assertions, summary, and results widgets can only be displayed once, so if it is already visible you will not be able to add it again.
Add/Customize a Chart
To add a chart select the Add Chart action in the upper right action menu.
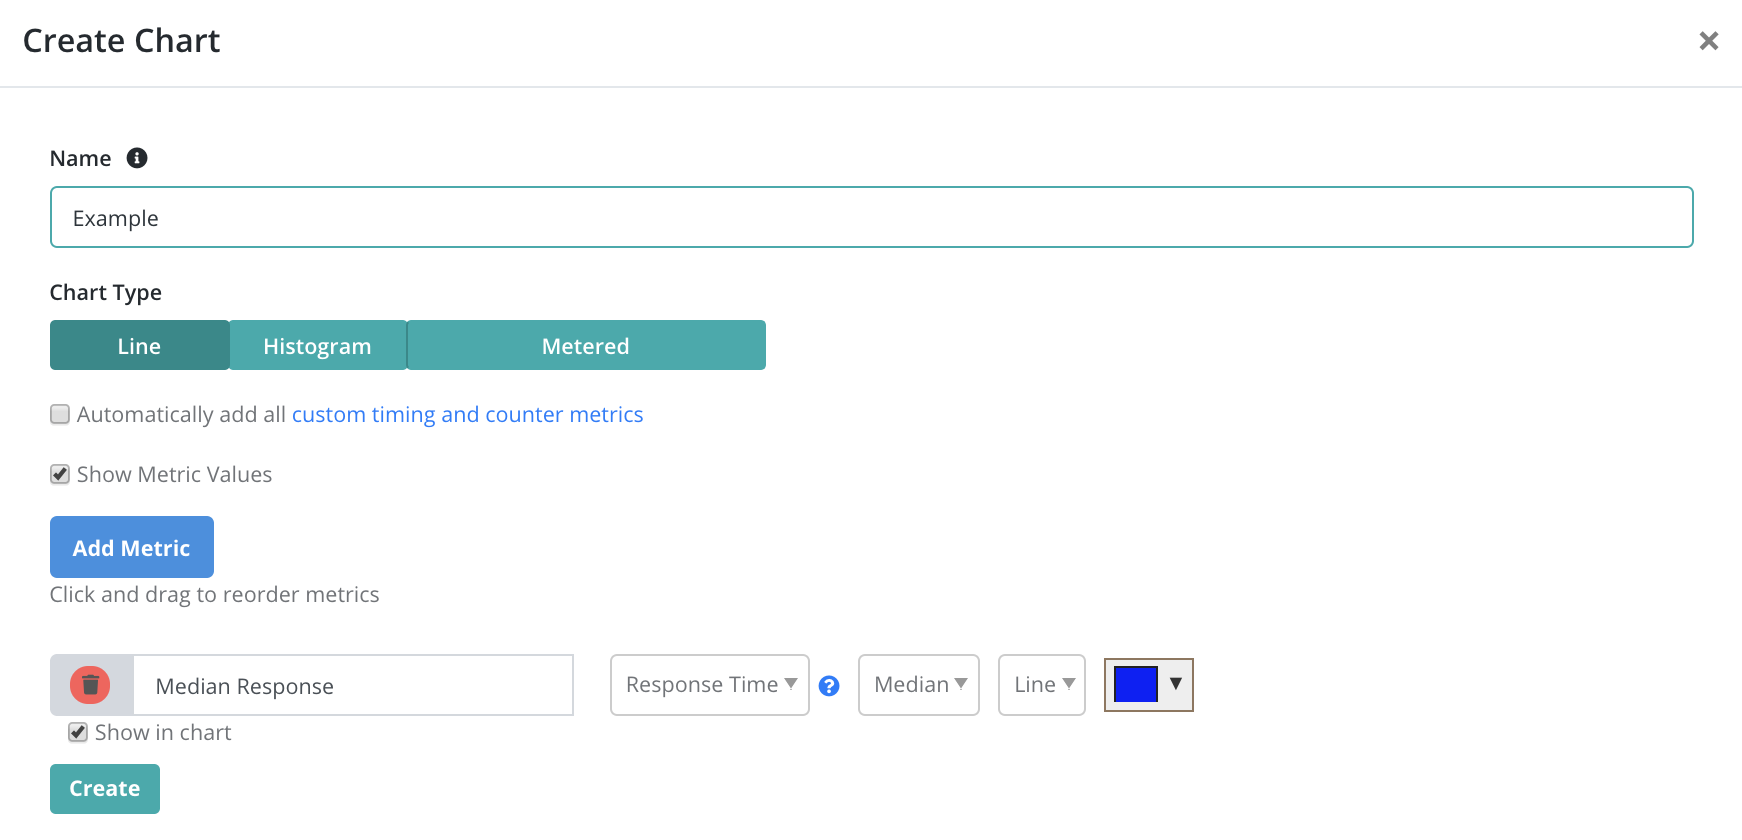
There are currently three types of charts:
- Line: Time is plotted on the x-axis and whichever metrics are selected on the y-axis.
- Histogram: A histogram which visualizes the count per bucket using a donut chart or table.
- Metered: For metered metrics like test runner memory, CPU, and bandwidth. Shows peak usage during the test, a chart of usage by interval, and a breakdown of usage by test runner instance.
Next select the metrics to display and whether or not they should be graphed by default in the chart or just shown across the top of the widget. Note that you can click on a metric across the top to toggle it on/off in the chart.
Click the Add Chart button to add it to the view.
Click the configure icon on any chart widget to customize its name and metrics.
New charts are always added as the first widget at the top.
Images Widget
To add the Images widget select the Add Images action in the dropdown menu in the upper right. This will display any screenshots captured during your test with the most recent image first. As a reminder browser based tools like Selenium Webdriver.io, Phantomjs, and Slimerjs all support capturing screenshots.
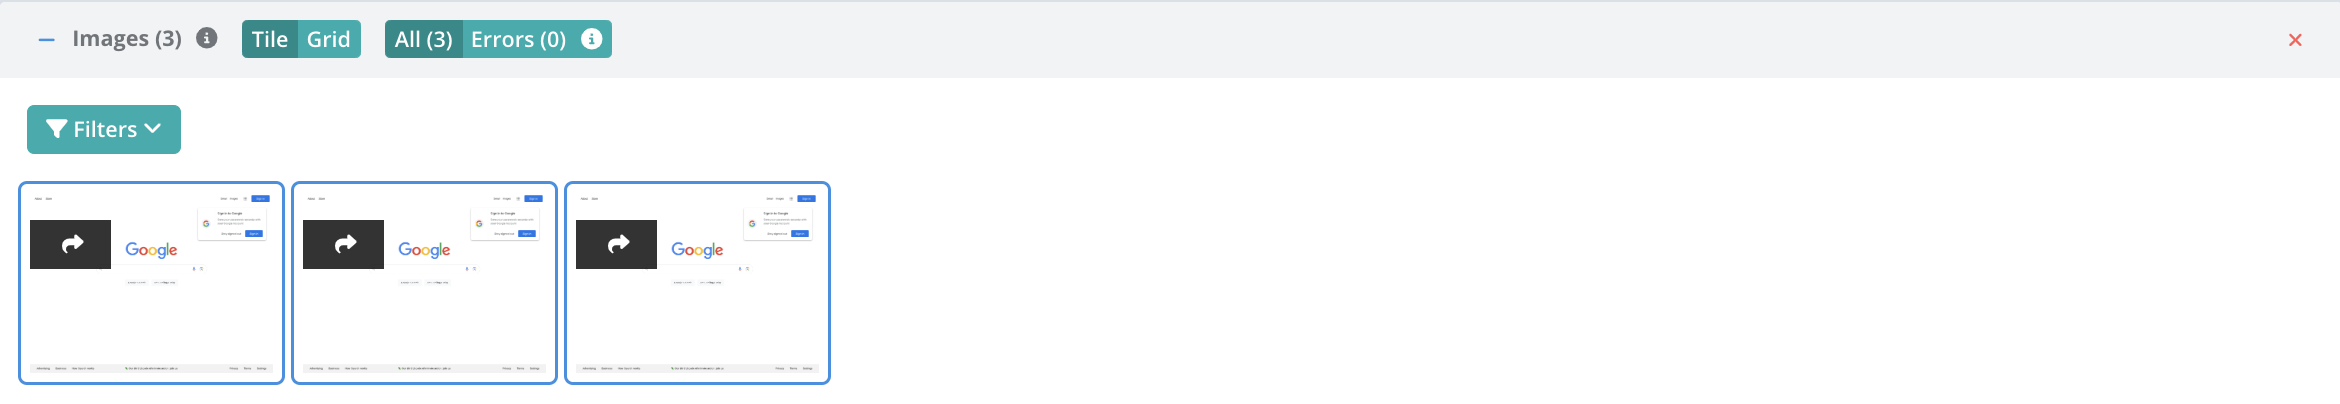
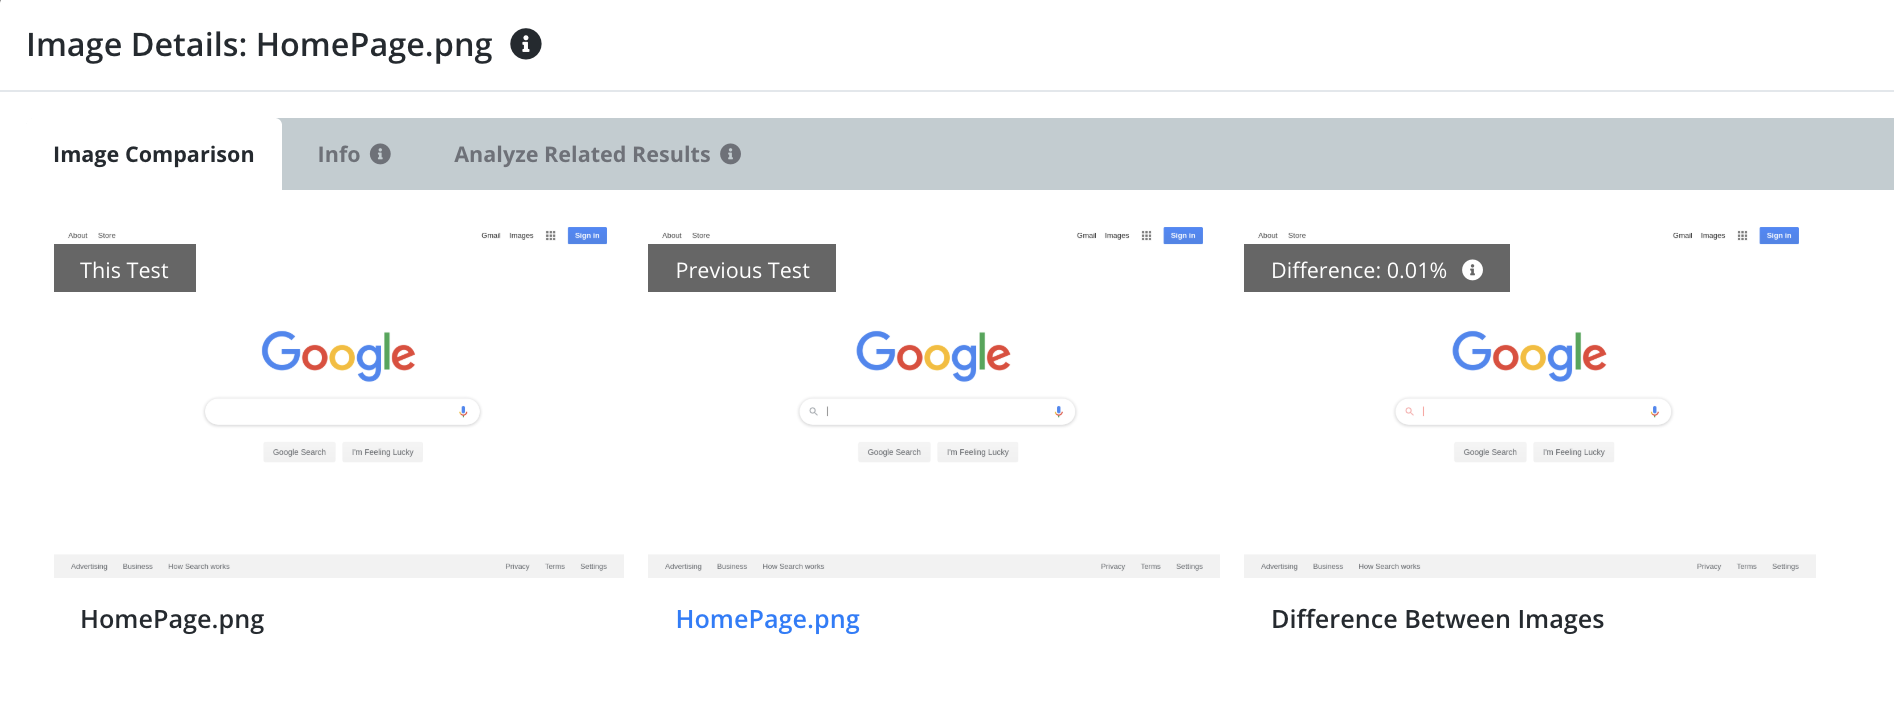
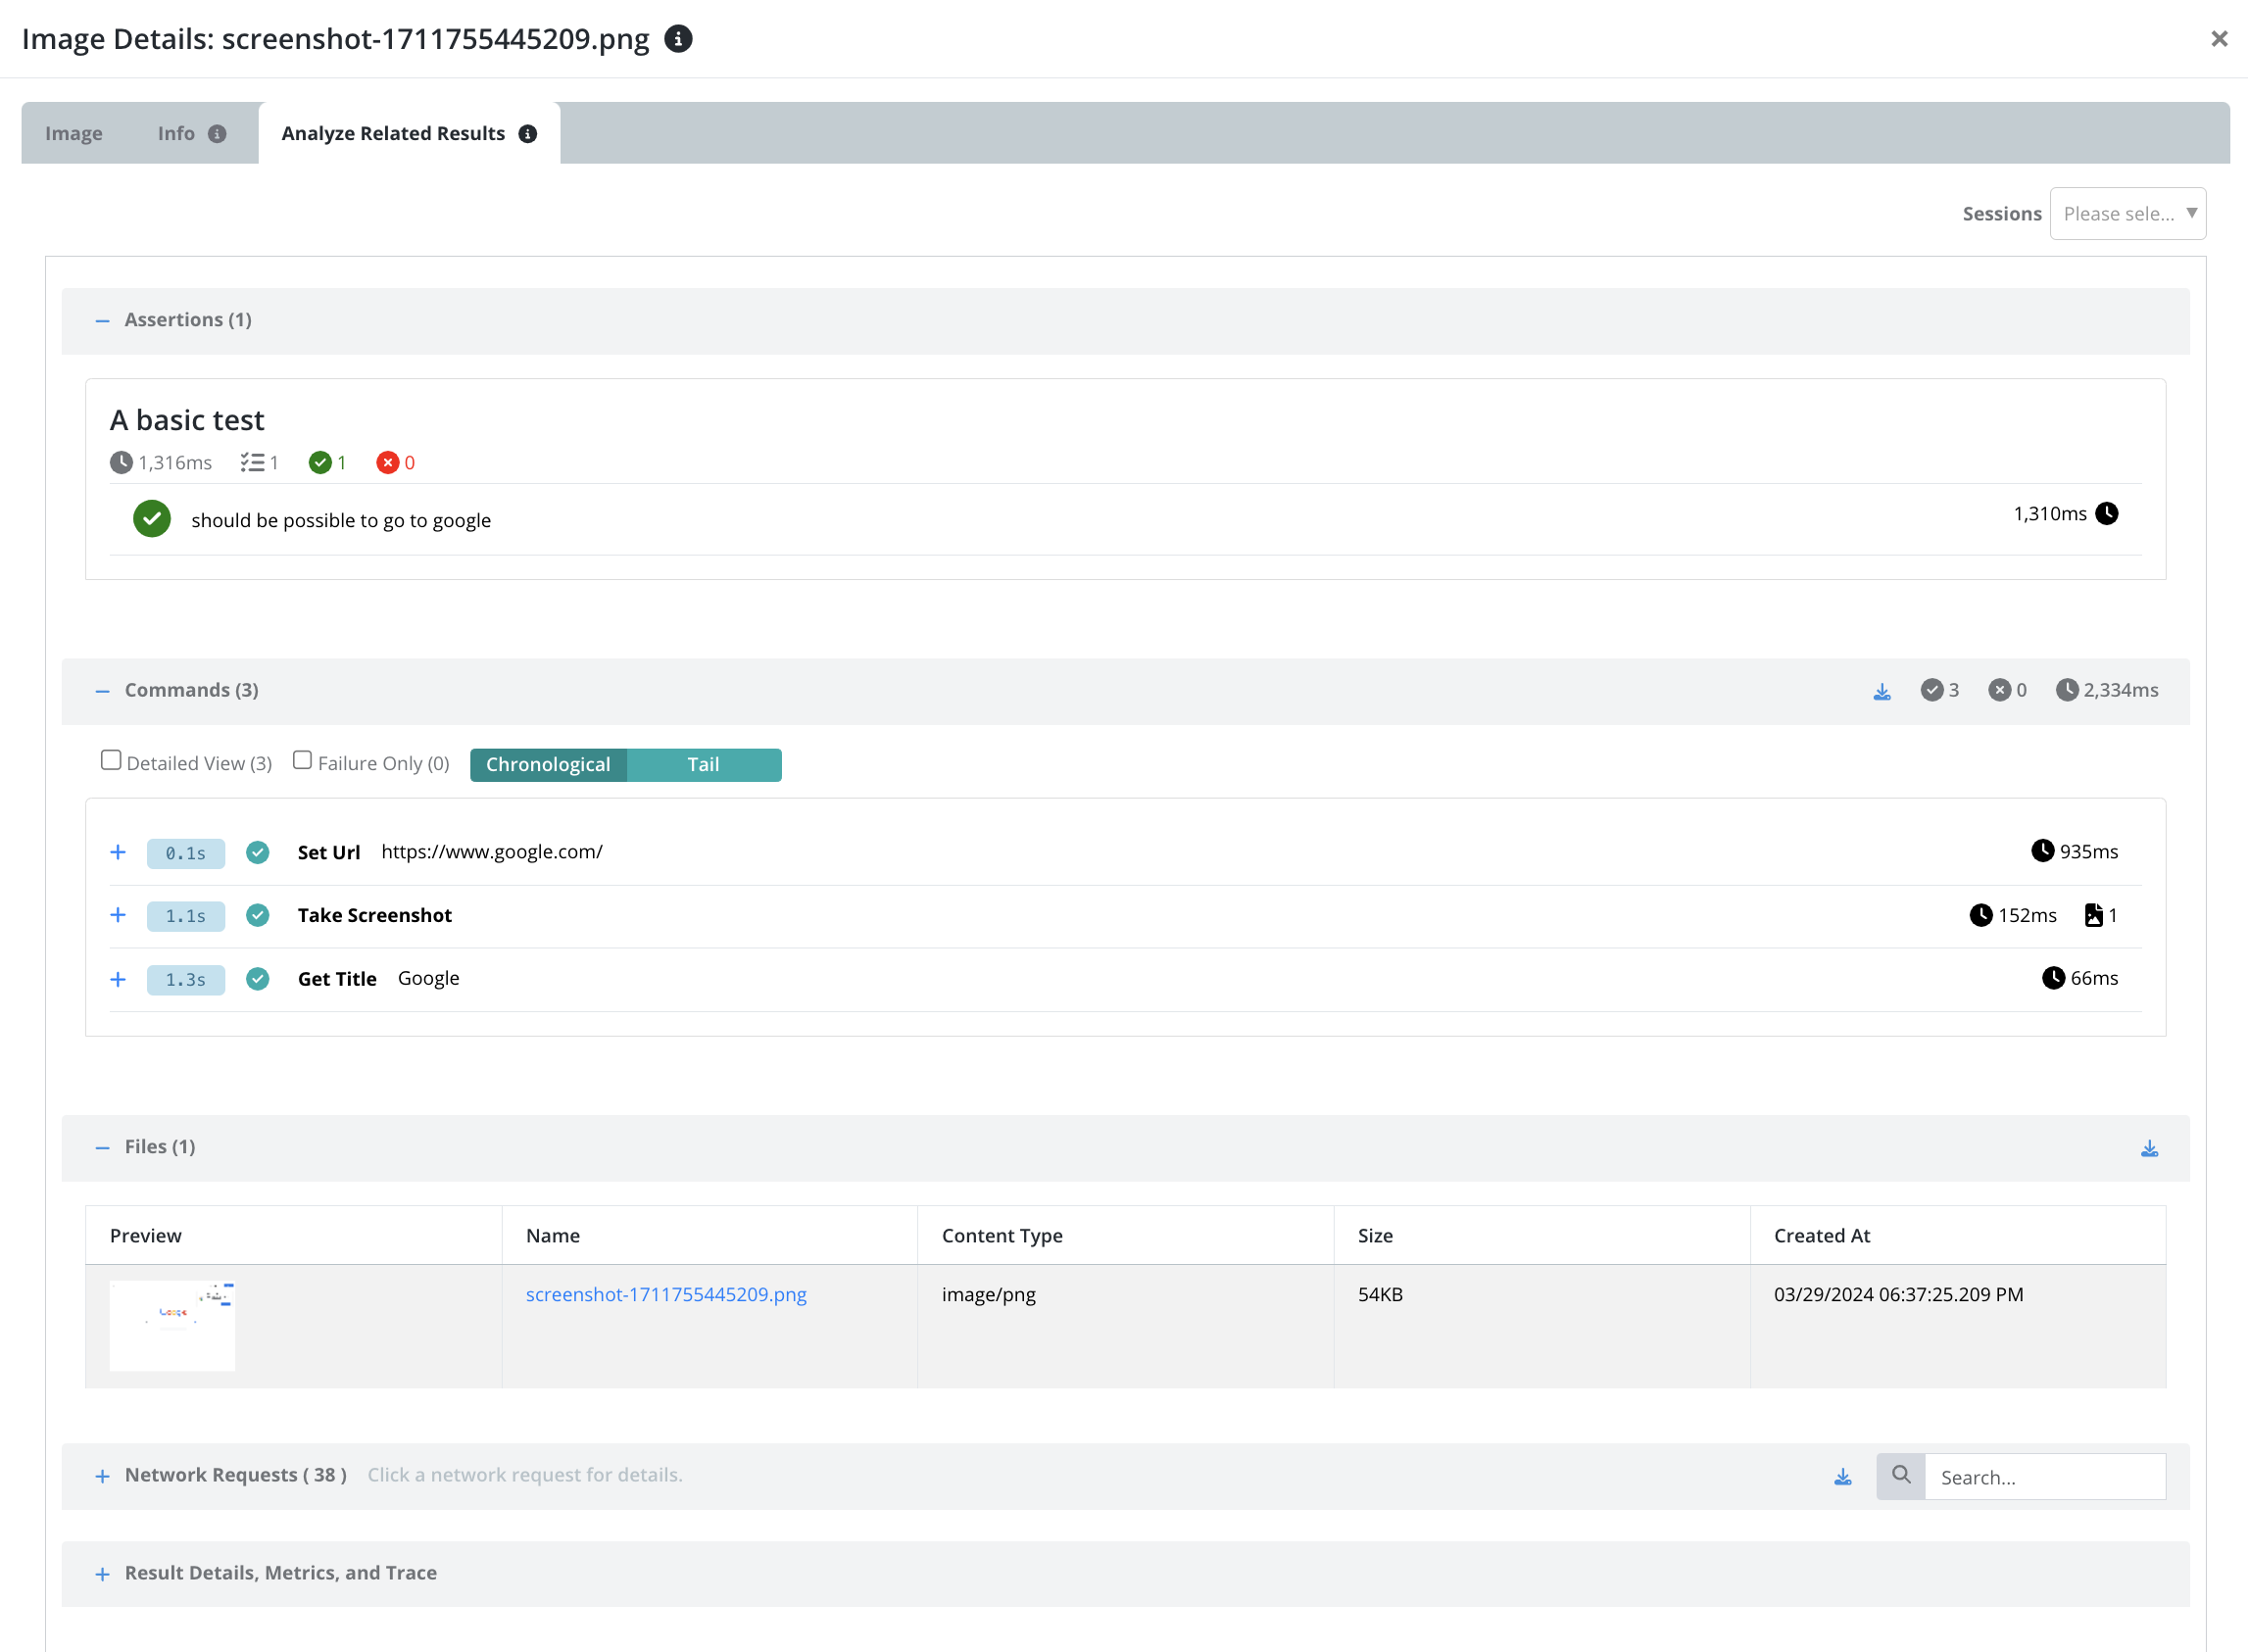
Clicking on any image will show you a pop-up with a variety of information that is helpful for analysis including: a visual diff against the same image in previous test runs, related assertions, and related network requests made during the test iteration in which this image was captured.
Customize Summary
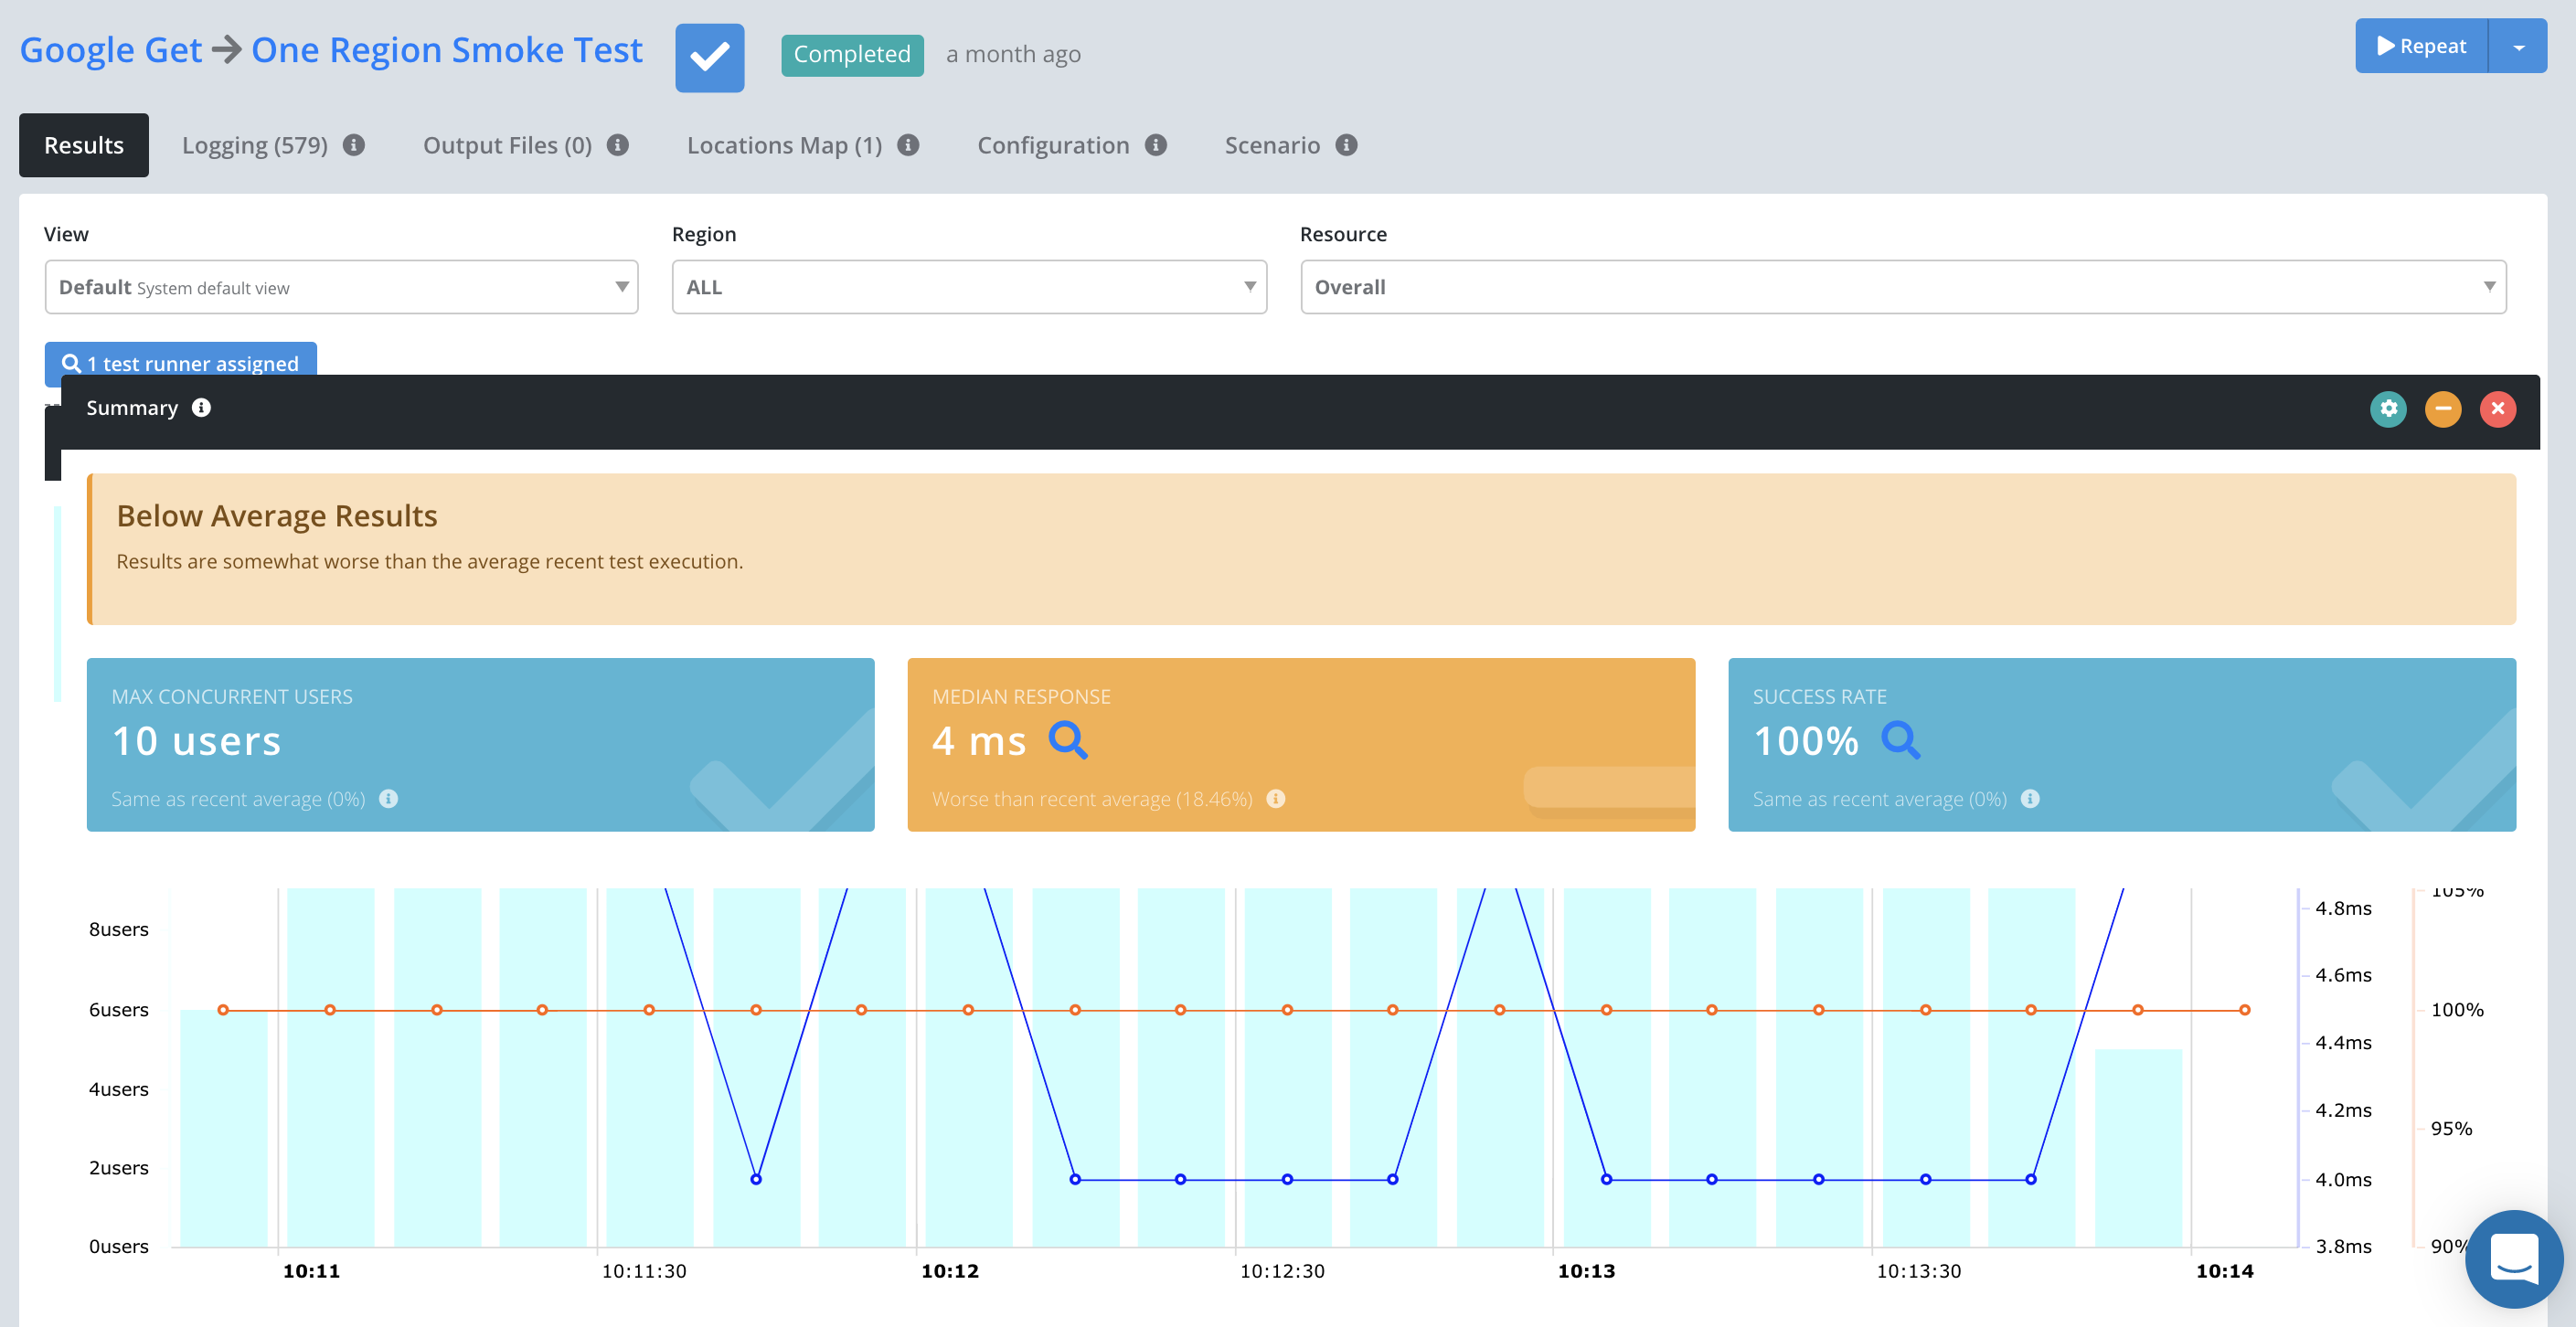
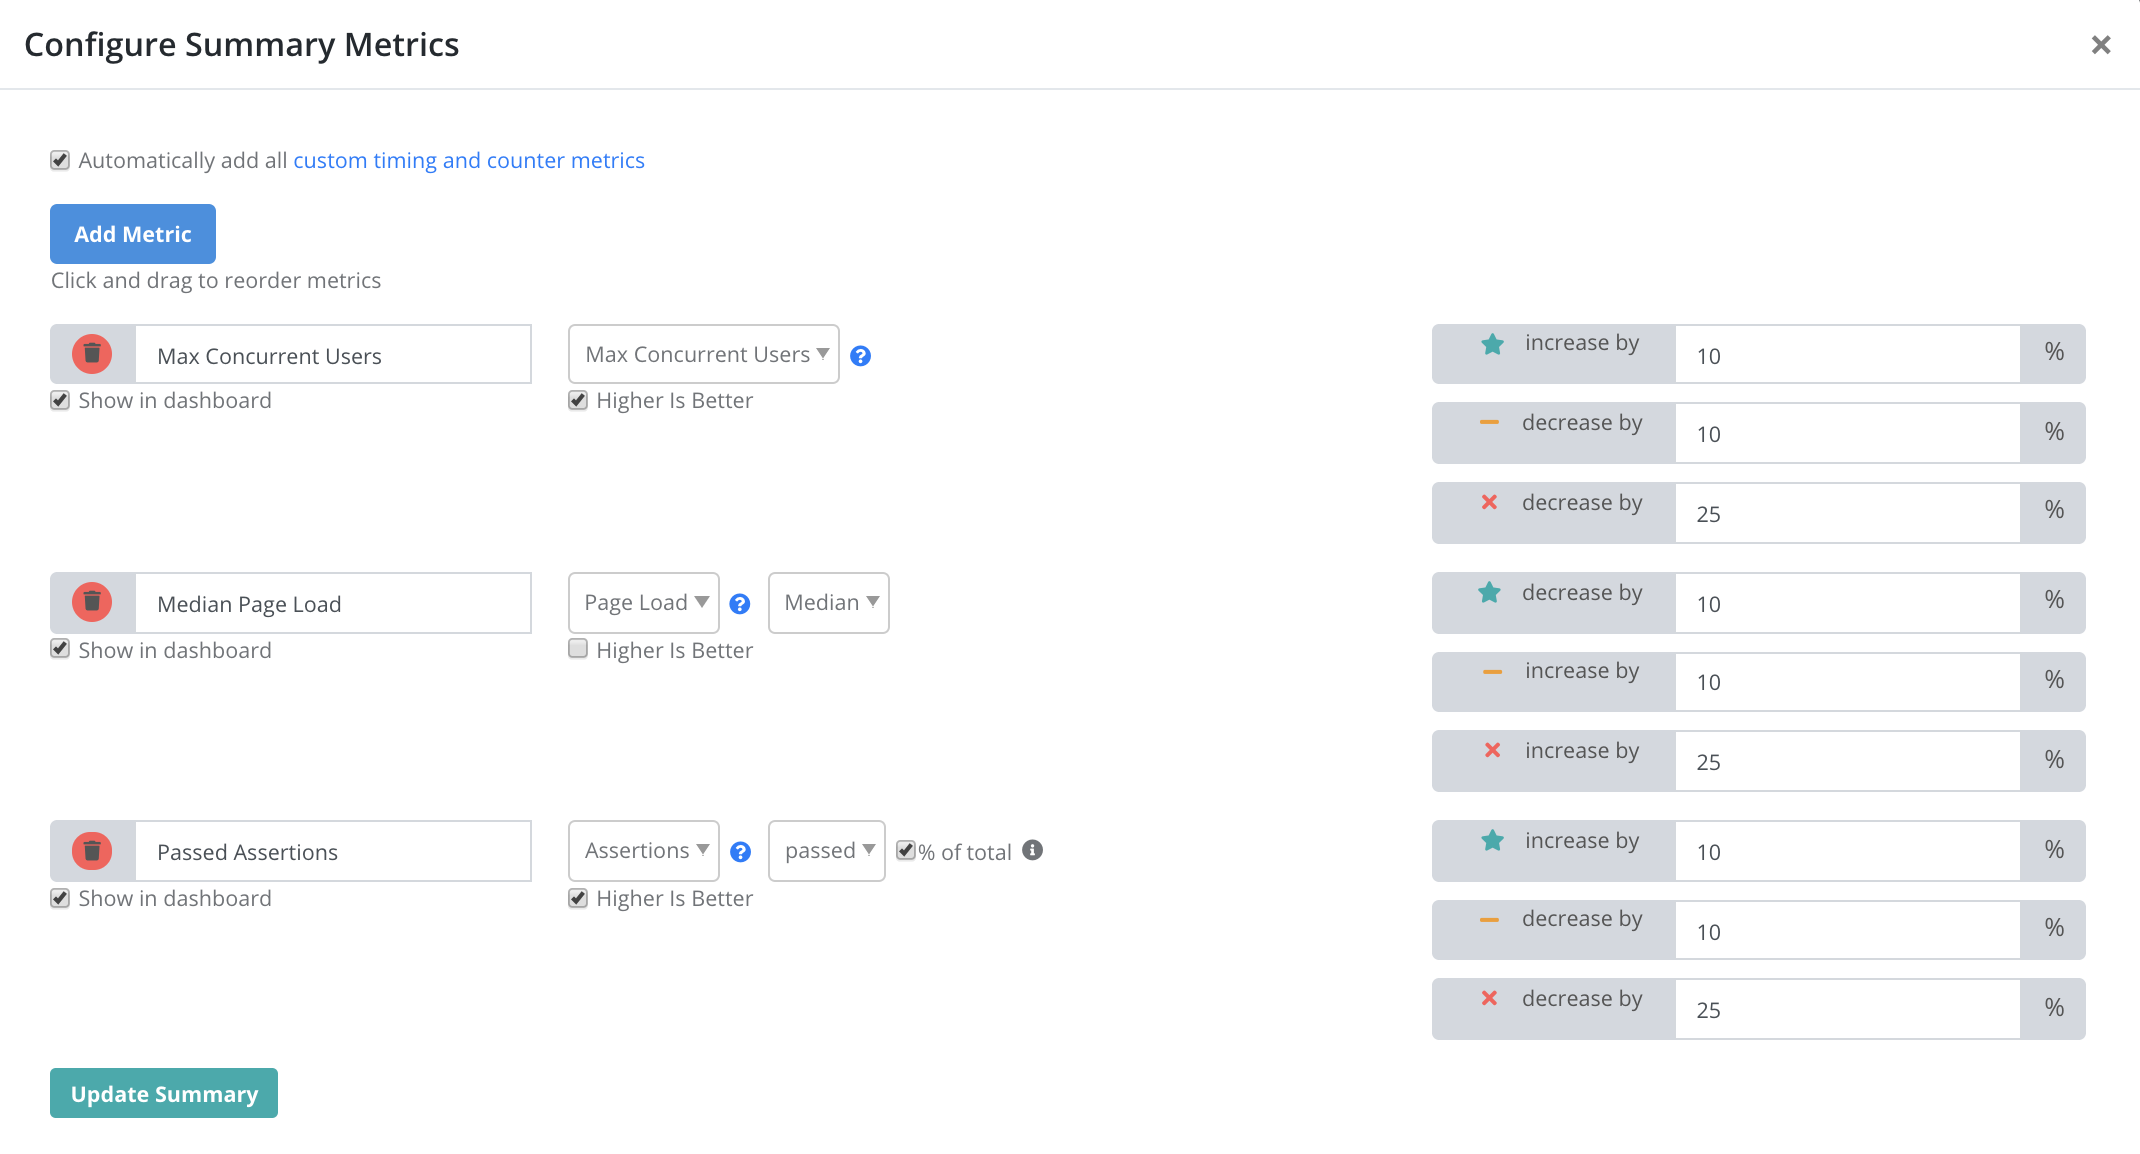
The summary widget provides a quick high level analysis of this test execution and how it compares to other recent executions of the same configuration. You can customize which metrics are part of this analysis and what percentage change thresholds are considered an improvement, consistent, concerning, or a failure. Note that the percentage change is relative to that metric across a weighted average of the last 10 (if that many exist) test executions.
Click the configure icon on the Summary panel to customize.
Any column with the ‘Show in dashboard’ checkbox will show up on the home page and the execution history if this view is made the default one.
Customize By Resources Grid
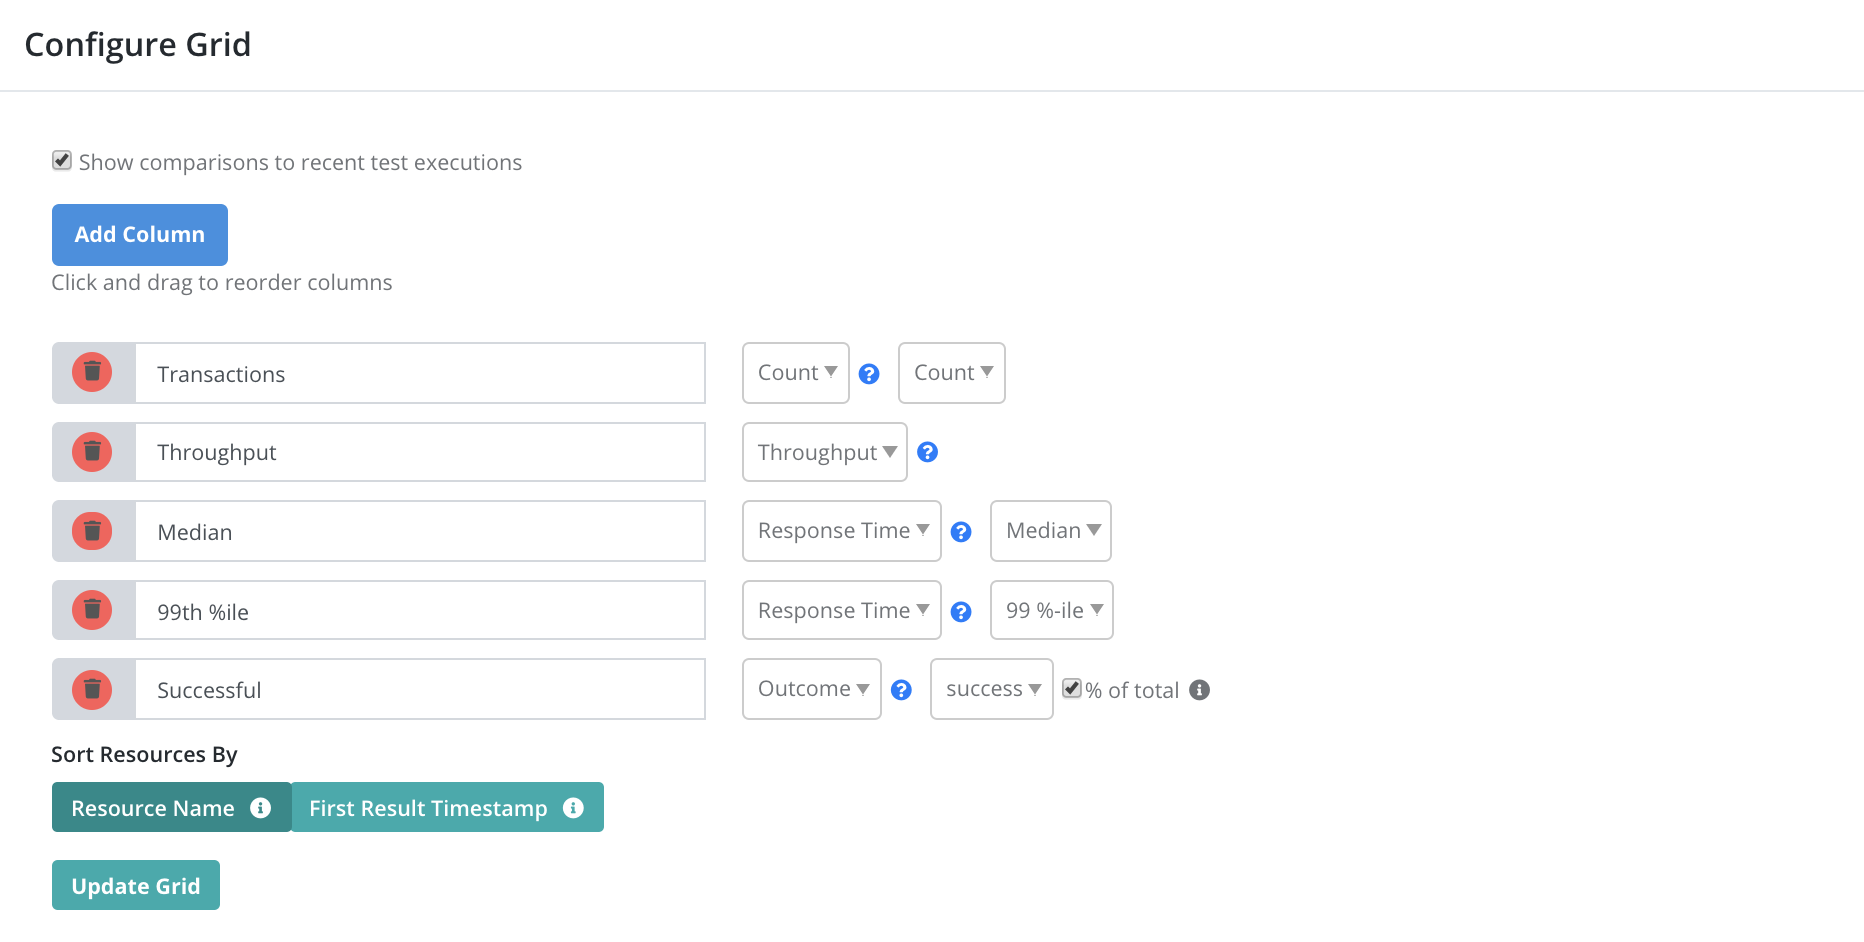
Click the configure icon on the Results widget to customize which metrics are displayed in the grid.
View Actions
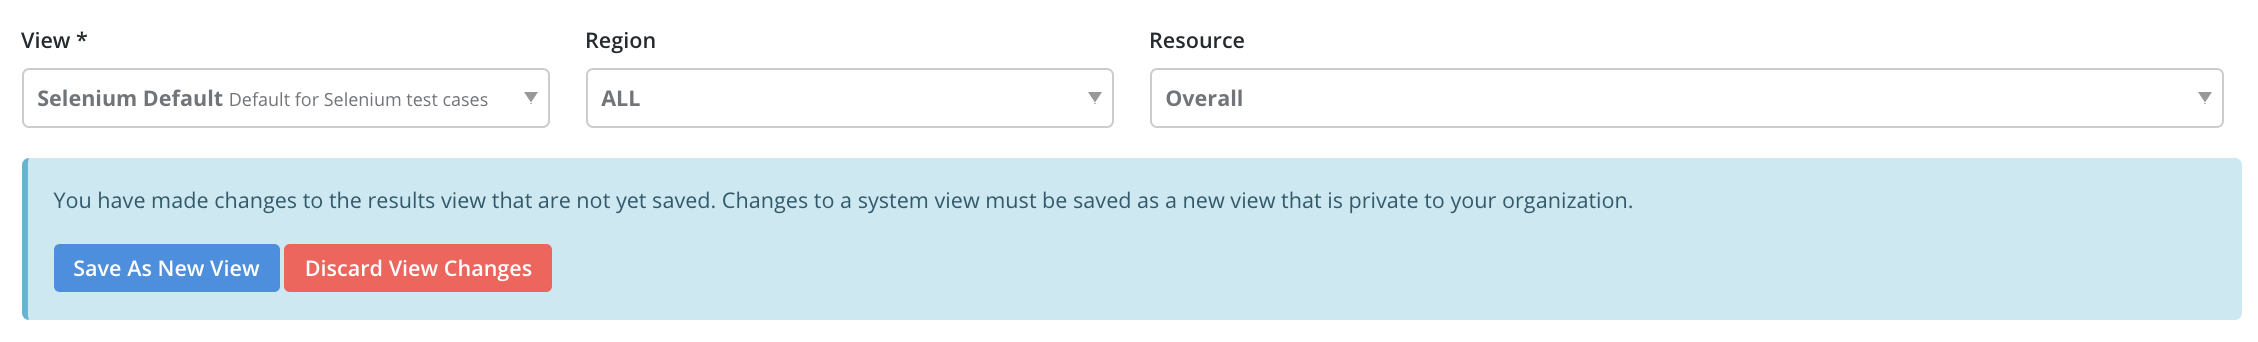
If any changes have been made to the view a ** * ** appears at the top of the view along with several possible actions. You can also use the view menu to manage your view.
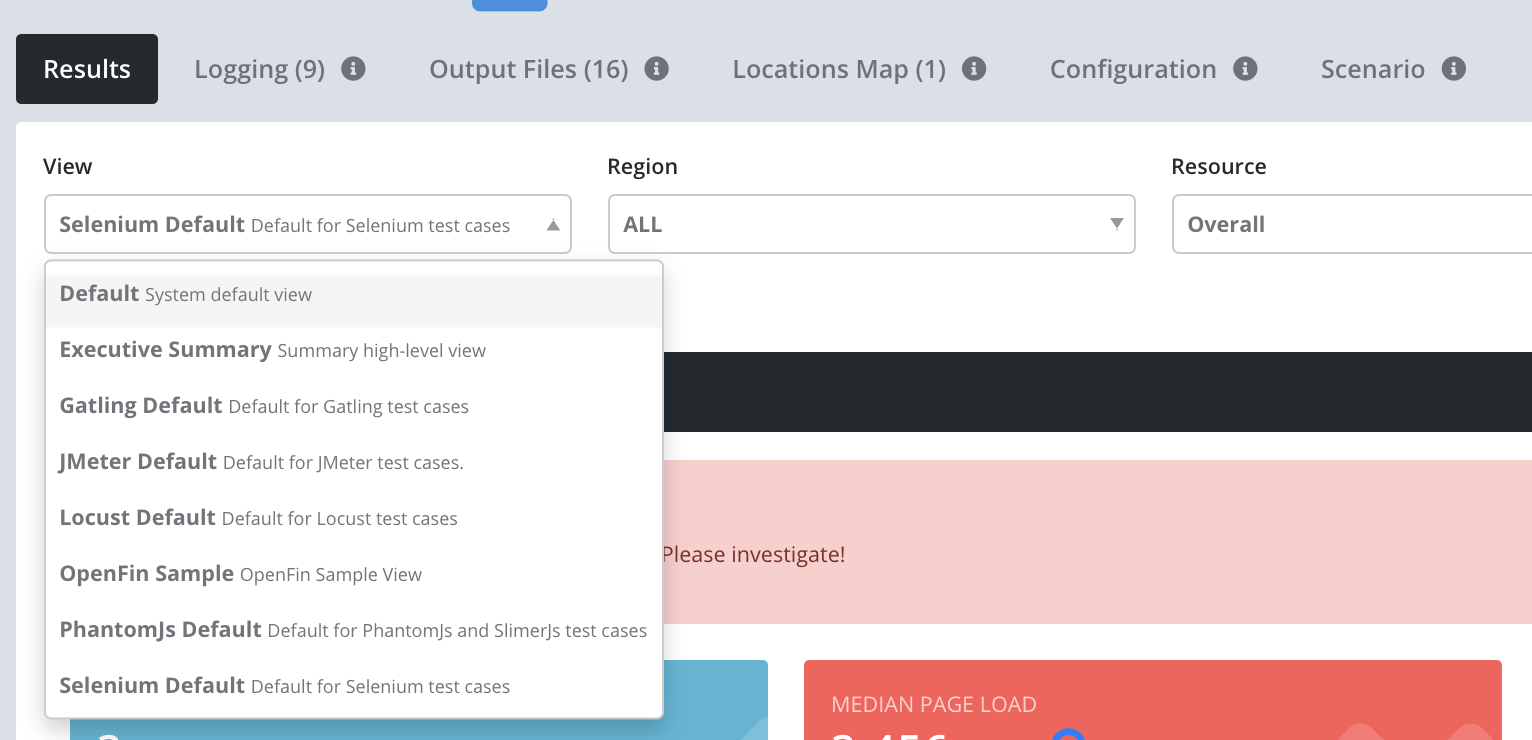
Switch Views
Use the View dropdown in the top left corner of the results to switch between different views.
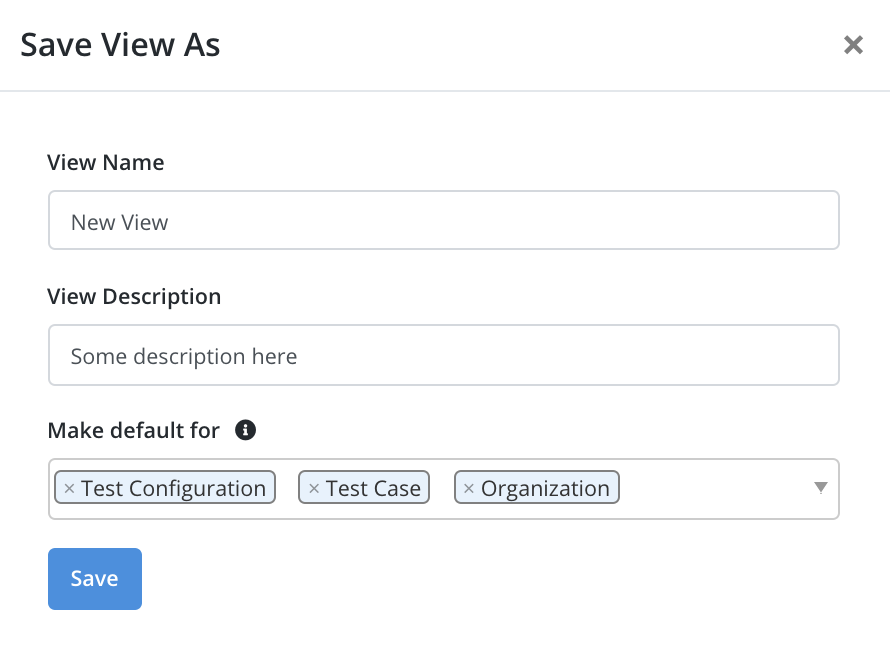
Save/Save As View
Save any customizations to this view or as a new view. Note that when you customize a System view it can only be saved as a new view.
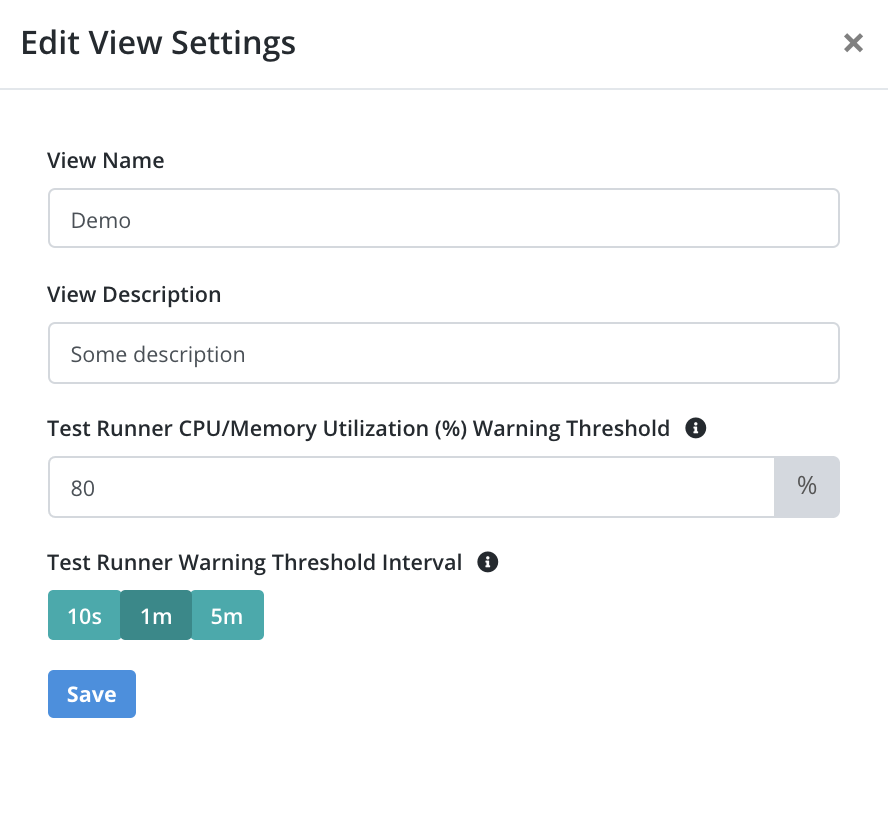
Edit Settings
Give the view a different name or change other view settings like the threshold at which a test runner is considered overloaded. Not supported for the default view.
Delete View
Delete the view. Not supported for system views.
Make Default View
Mark this view as the default one for this test configuration, test case, and/or account. Making a view the default for a test configuration overrides the default view for the test case which override the default view for the account. The view will load by default when opening the results page. The default view configuration is also used on other pages as follows:
- Testable Home Page: In the Summary widget configuration, any metric that has the ‘Show in dashboard’ checkbox checked is displayed in the test cases grid.
- Test Configuration Grid: On the Test Case landing page, in the Test Configurations grid, any metric that has the ‘Show in dashboard’ checkbox checked is displayed.
- Test Execution History: Click on the name of a Test Configuration. The page has a grid showing the test execution history. The columns displayed are the ones that have the ‘Show in dashboard’ checkbox checked in the Summary configuration.
Export View Definition
Export the view definition to a JSON file to use in the simple API.