Getting Started - JMeter
Follow this guide for a basic example of running a JMeter test plan. For our example we will use a really simple test plan which simply makes an HTTP GET request for http://sample.testable.io/stocks/IBM and then sleeps for 300ms on each thread loop. The test plan can be found here.
Start by signing up and creating a new test case using the Create Test button on the dashboard.
Enter the test case name and then press Next.
Scenario
Select JMeter Test Plan as the Scenario type.
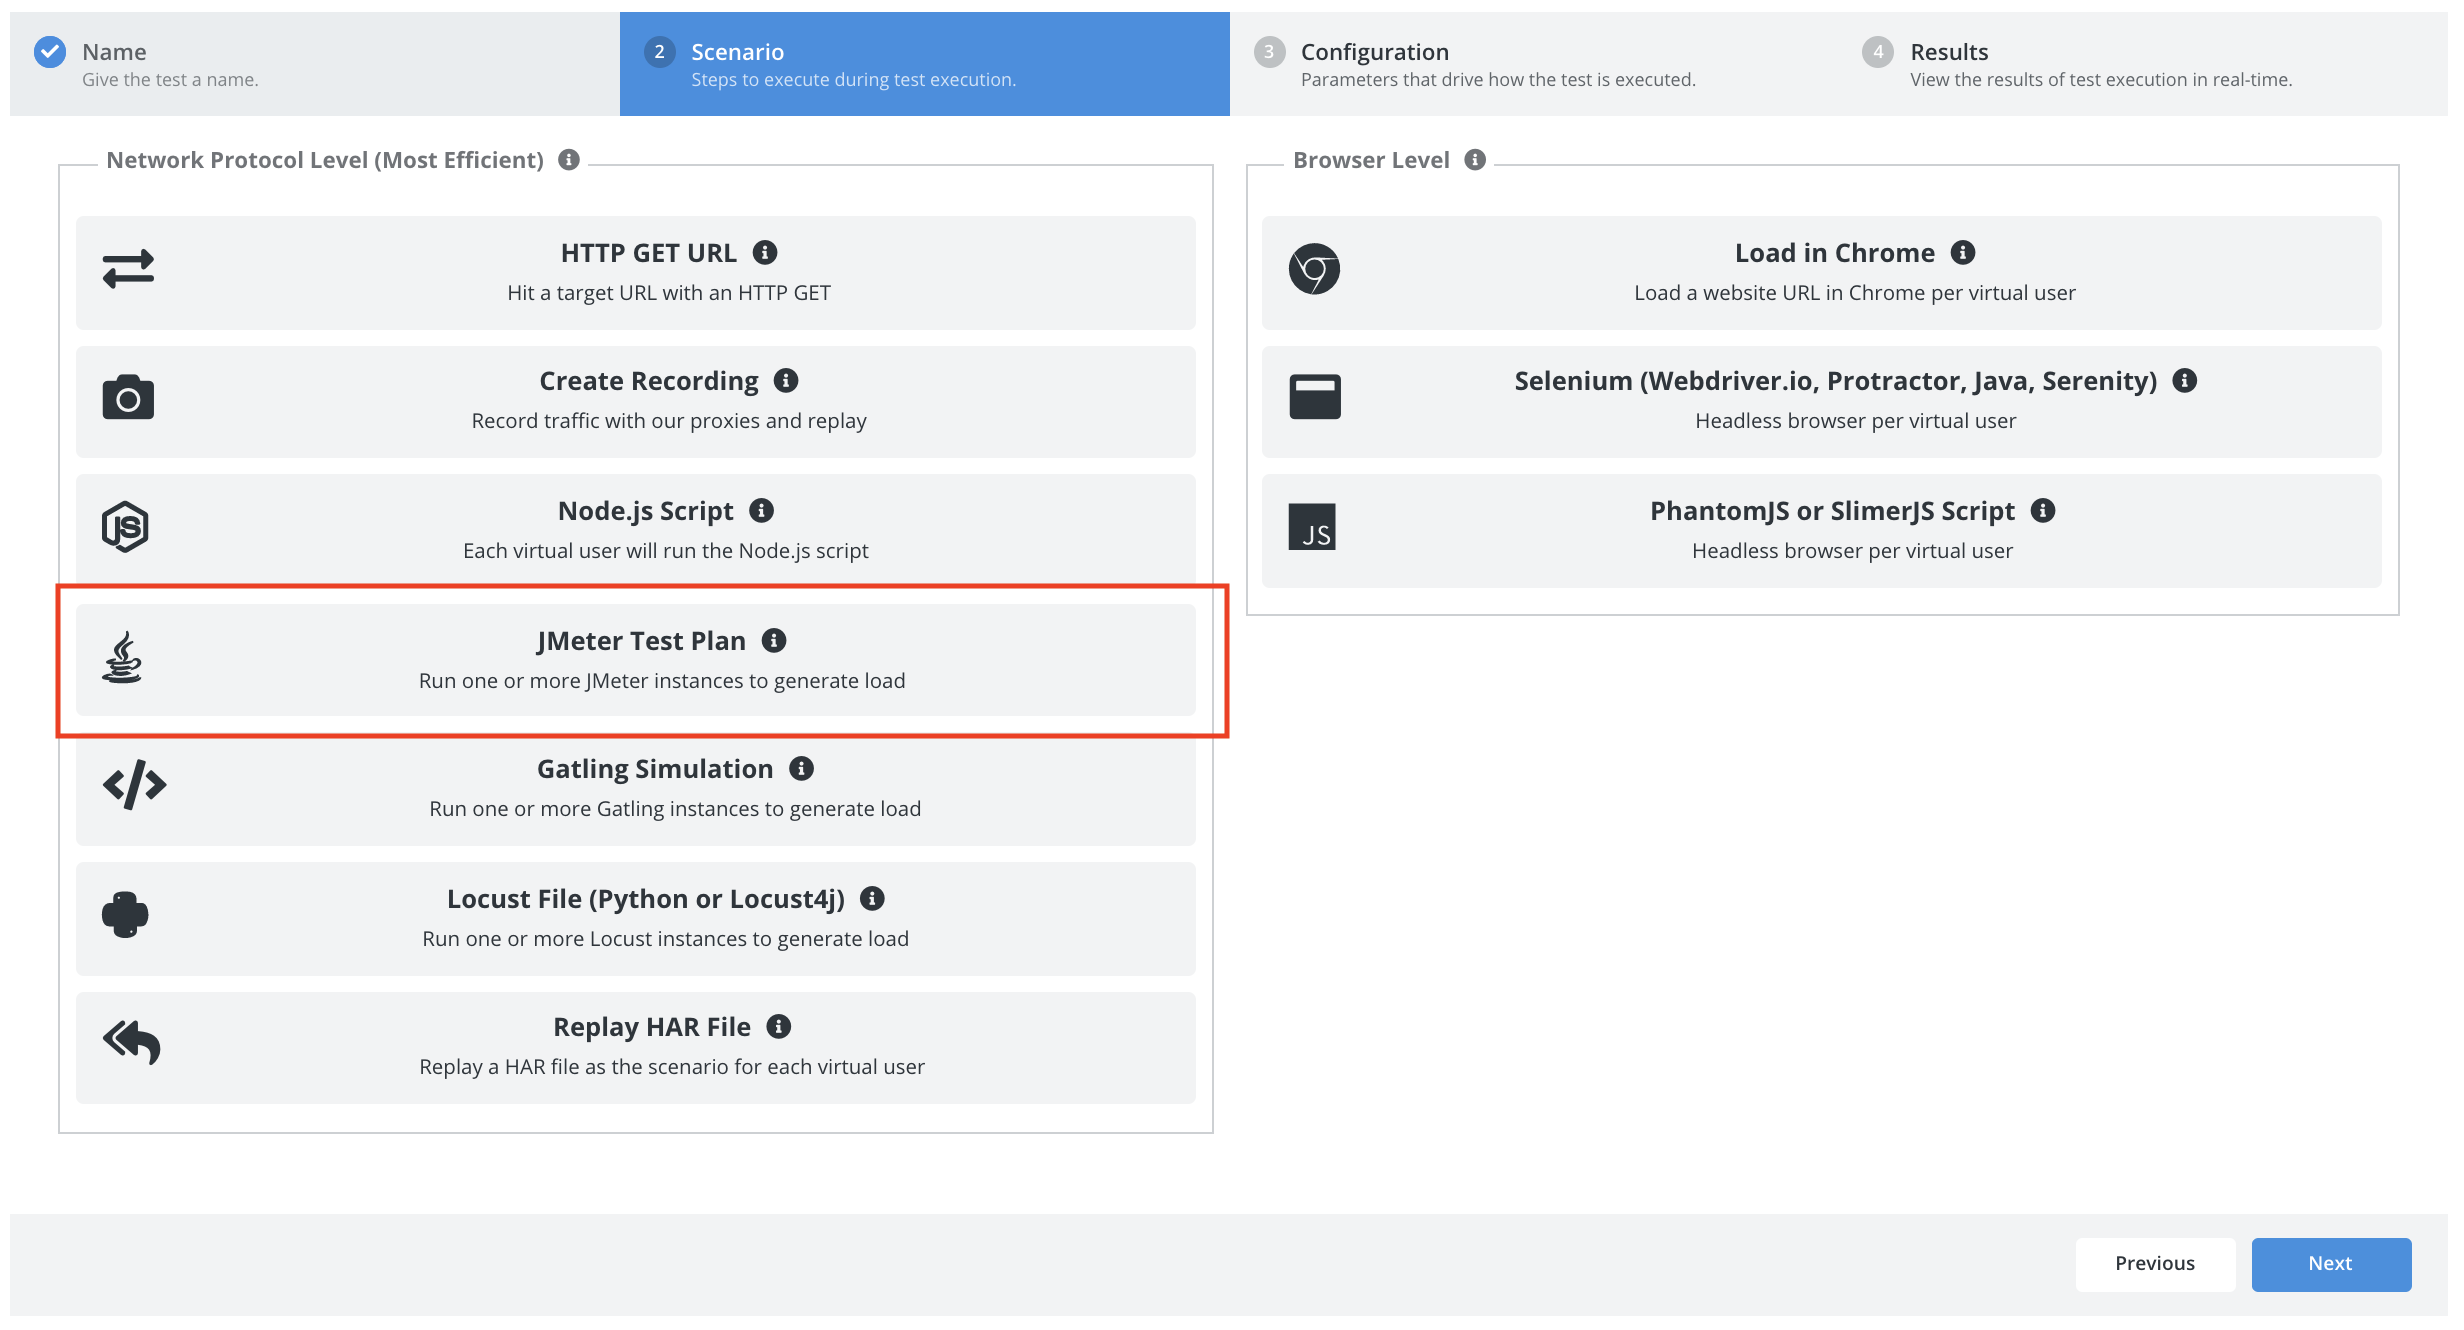
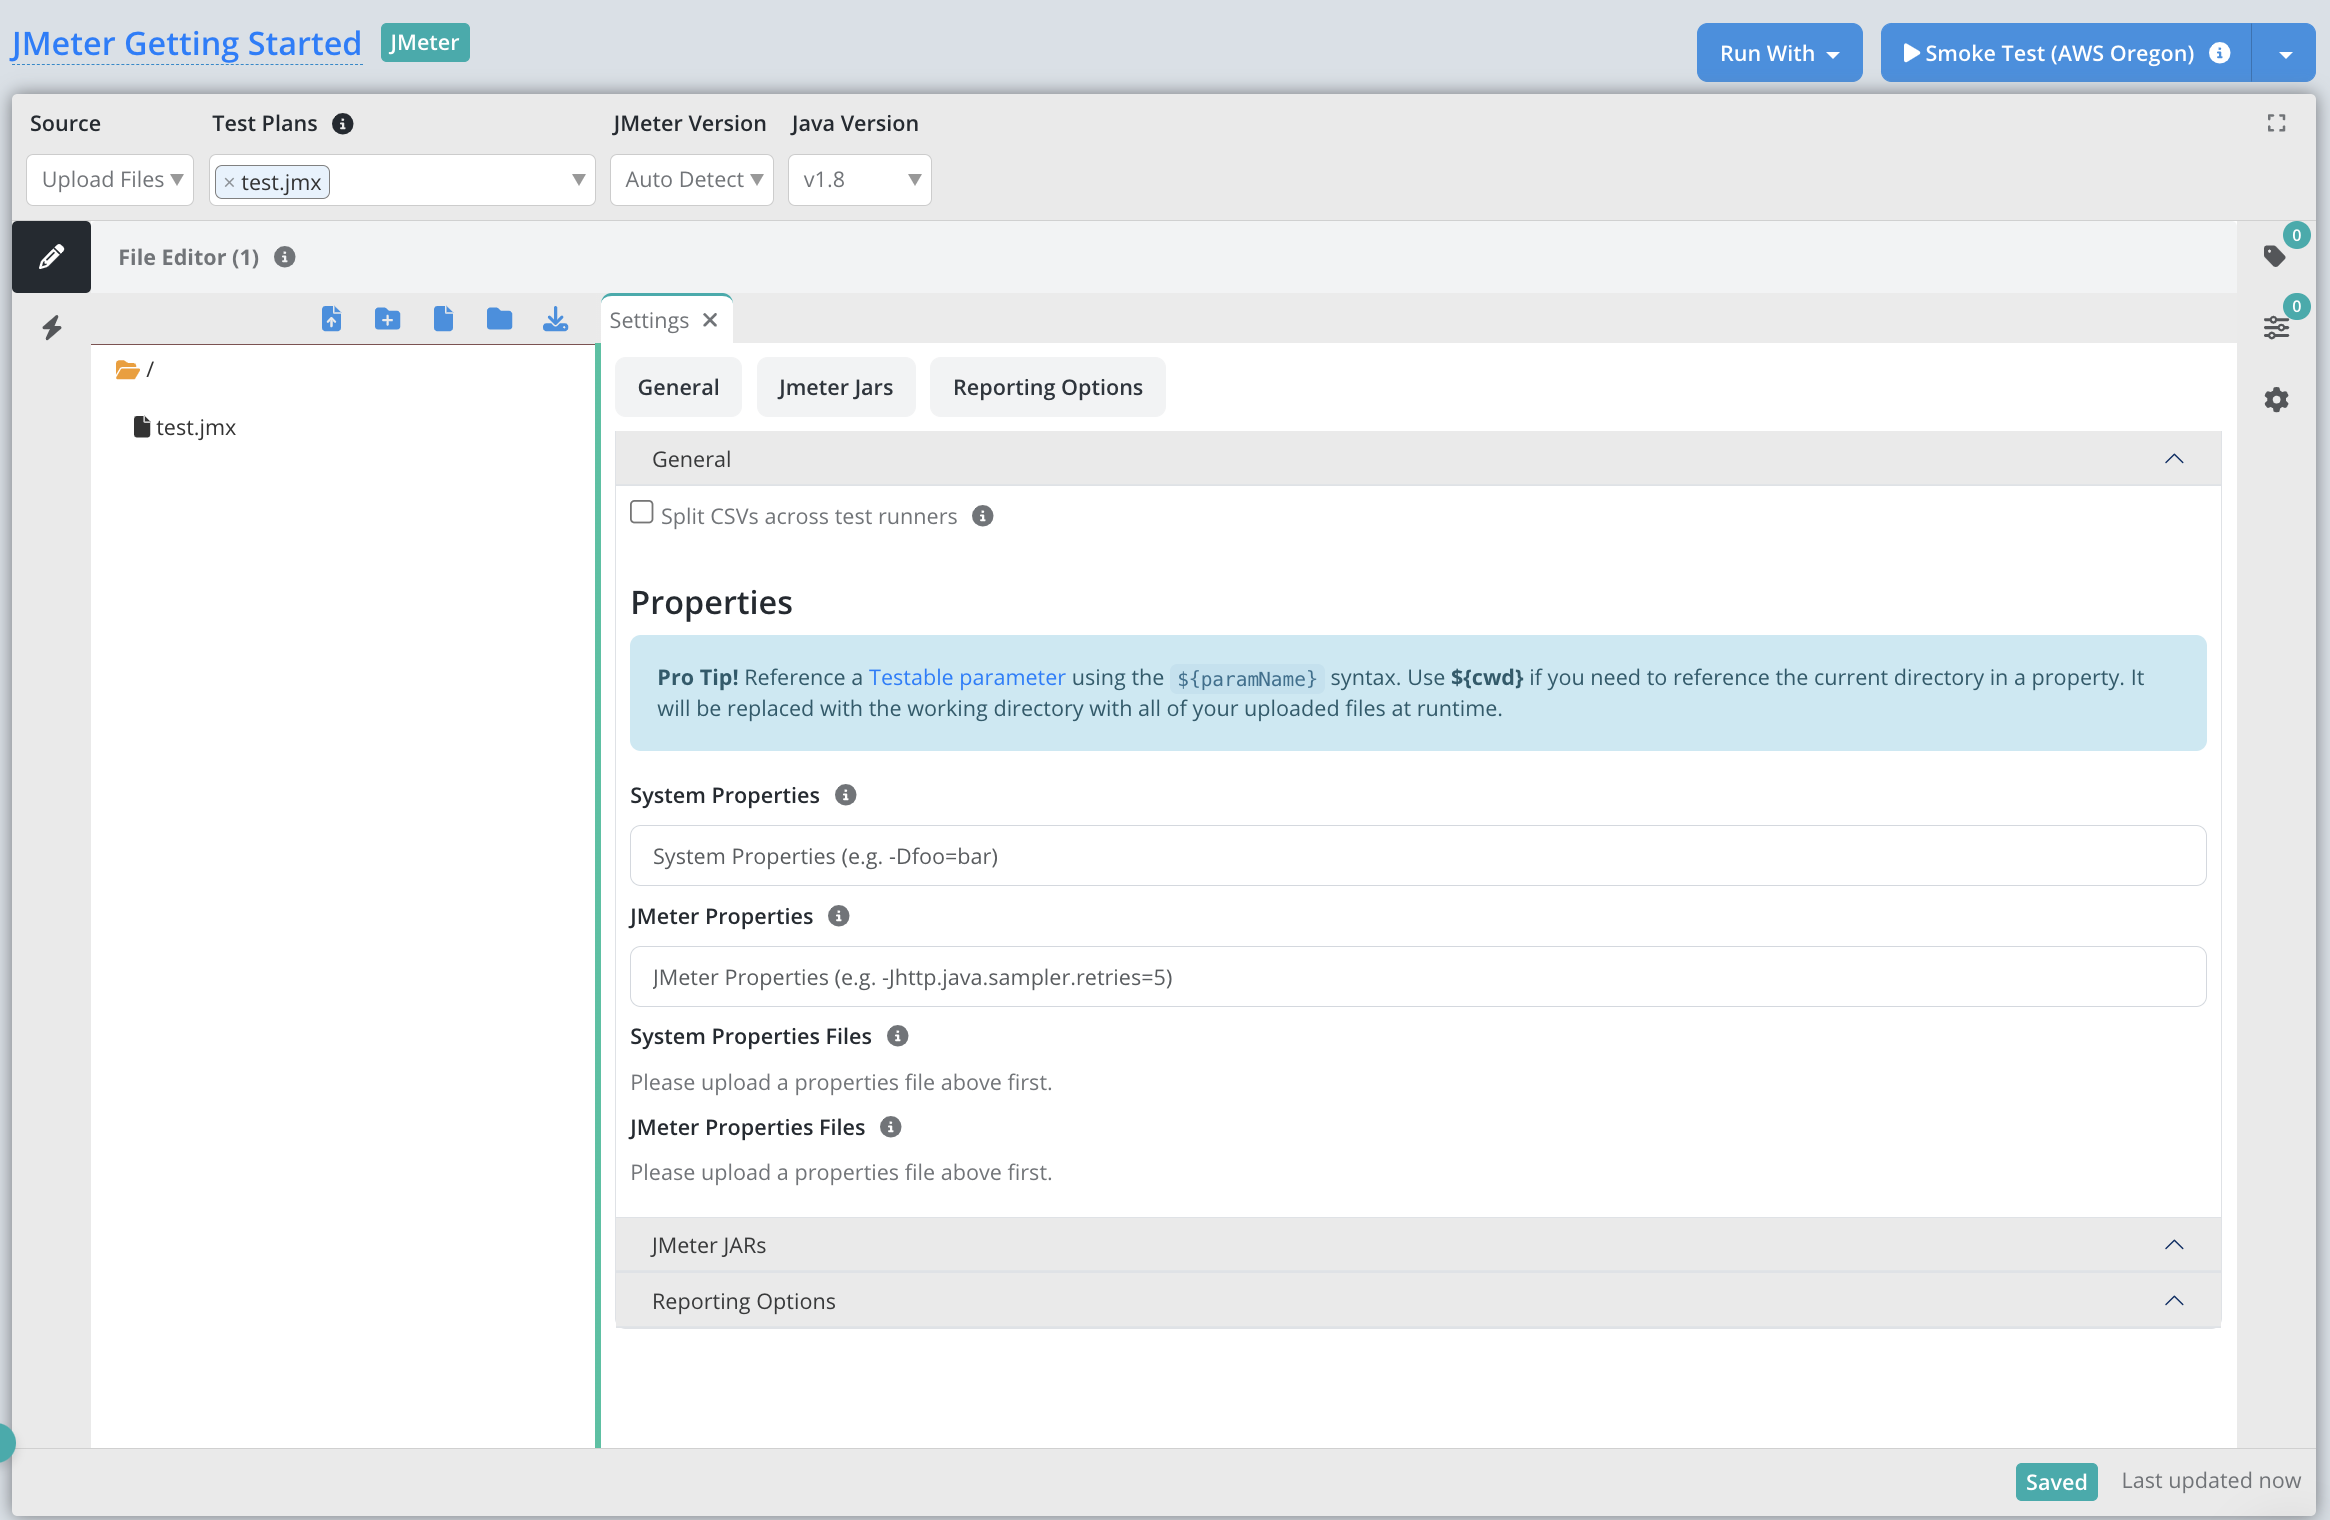
Click the Upload Test Plan button to upload the Test Plan (.jmx) file. For more complex tests you can upload any test related file here (e.g. CSV data, plugin jars, jmeter properties file, etc) or a zip file that contains the required files which will be automatically unzipped on the test runner before test execution.
Our example test plan uses a very simple thread group and reads threads (defaults to 5), duration (defaults to 120 seconds), and rampup (defaults to 30 seconds) from system properties using the ${__P(threads,5)} syntax. This enables Testable to control the load profile and duration directly.
Click the Smoke Test button in the upper right to run your test plan with 1 thread and 1 iteration on a Testable test runner. The output of the run will show up in the Smoke Test Output once it finishes.
And that’s it, we’ve now defined our scenario! Click on the Configuration tab or press the Next button at the bottom to move to the next step.
Configuration
Now that we have the scenario for our test case we need to define a few parameters before we can execute our test:
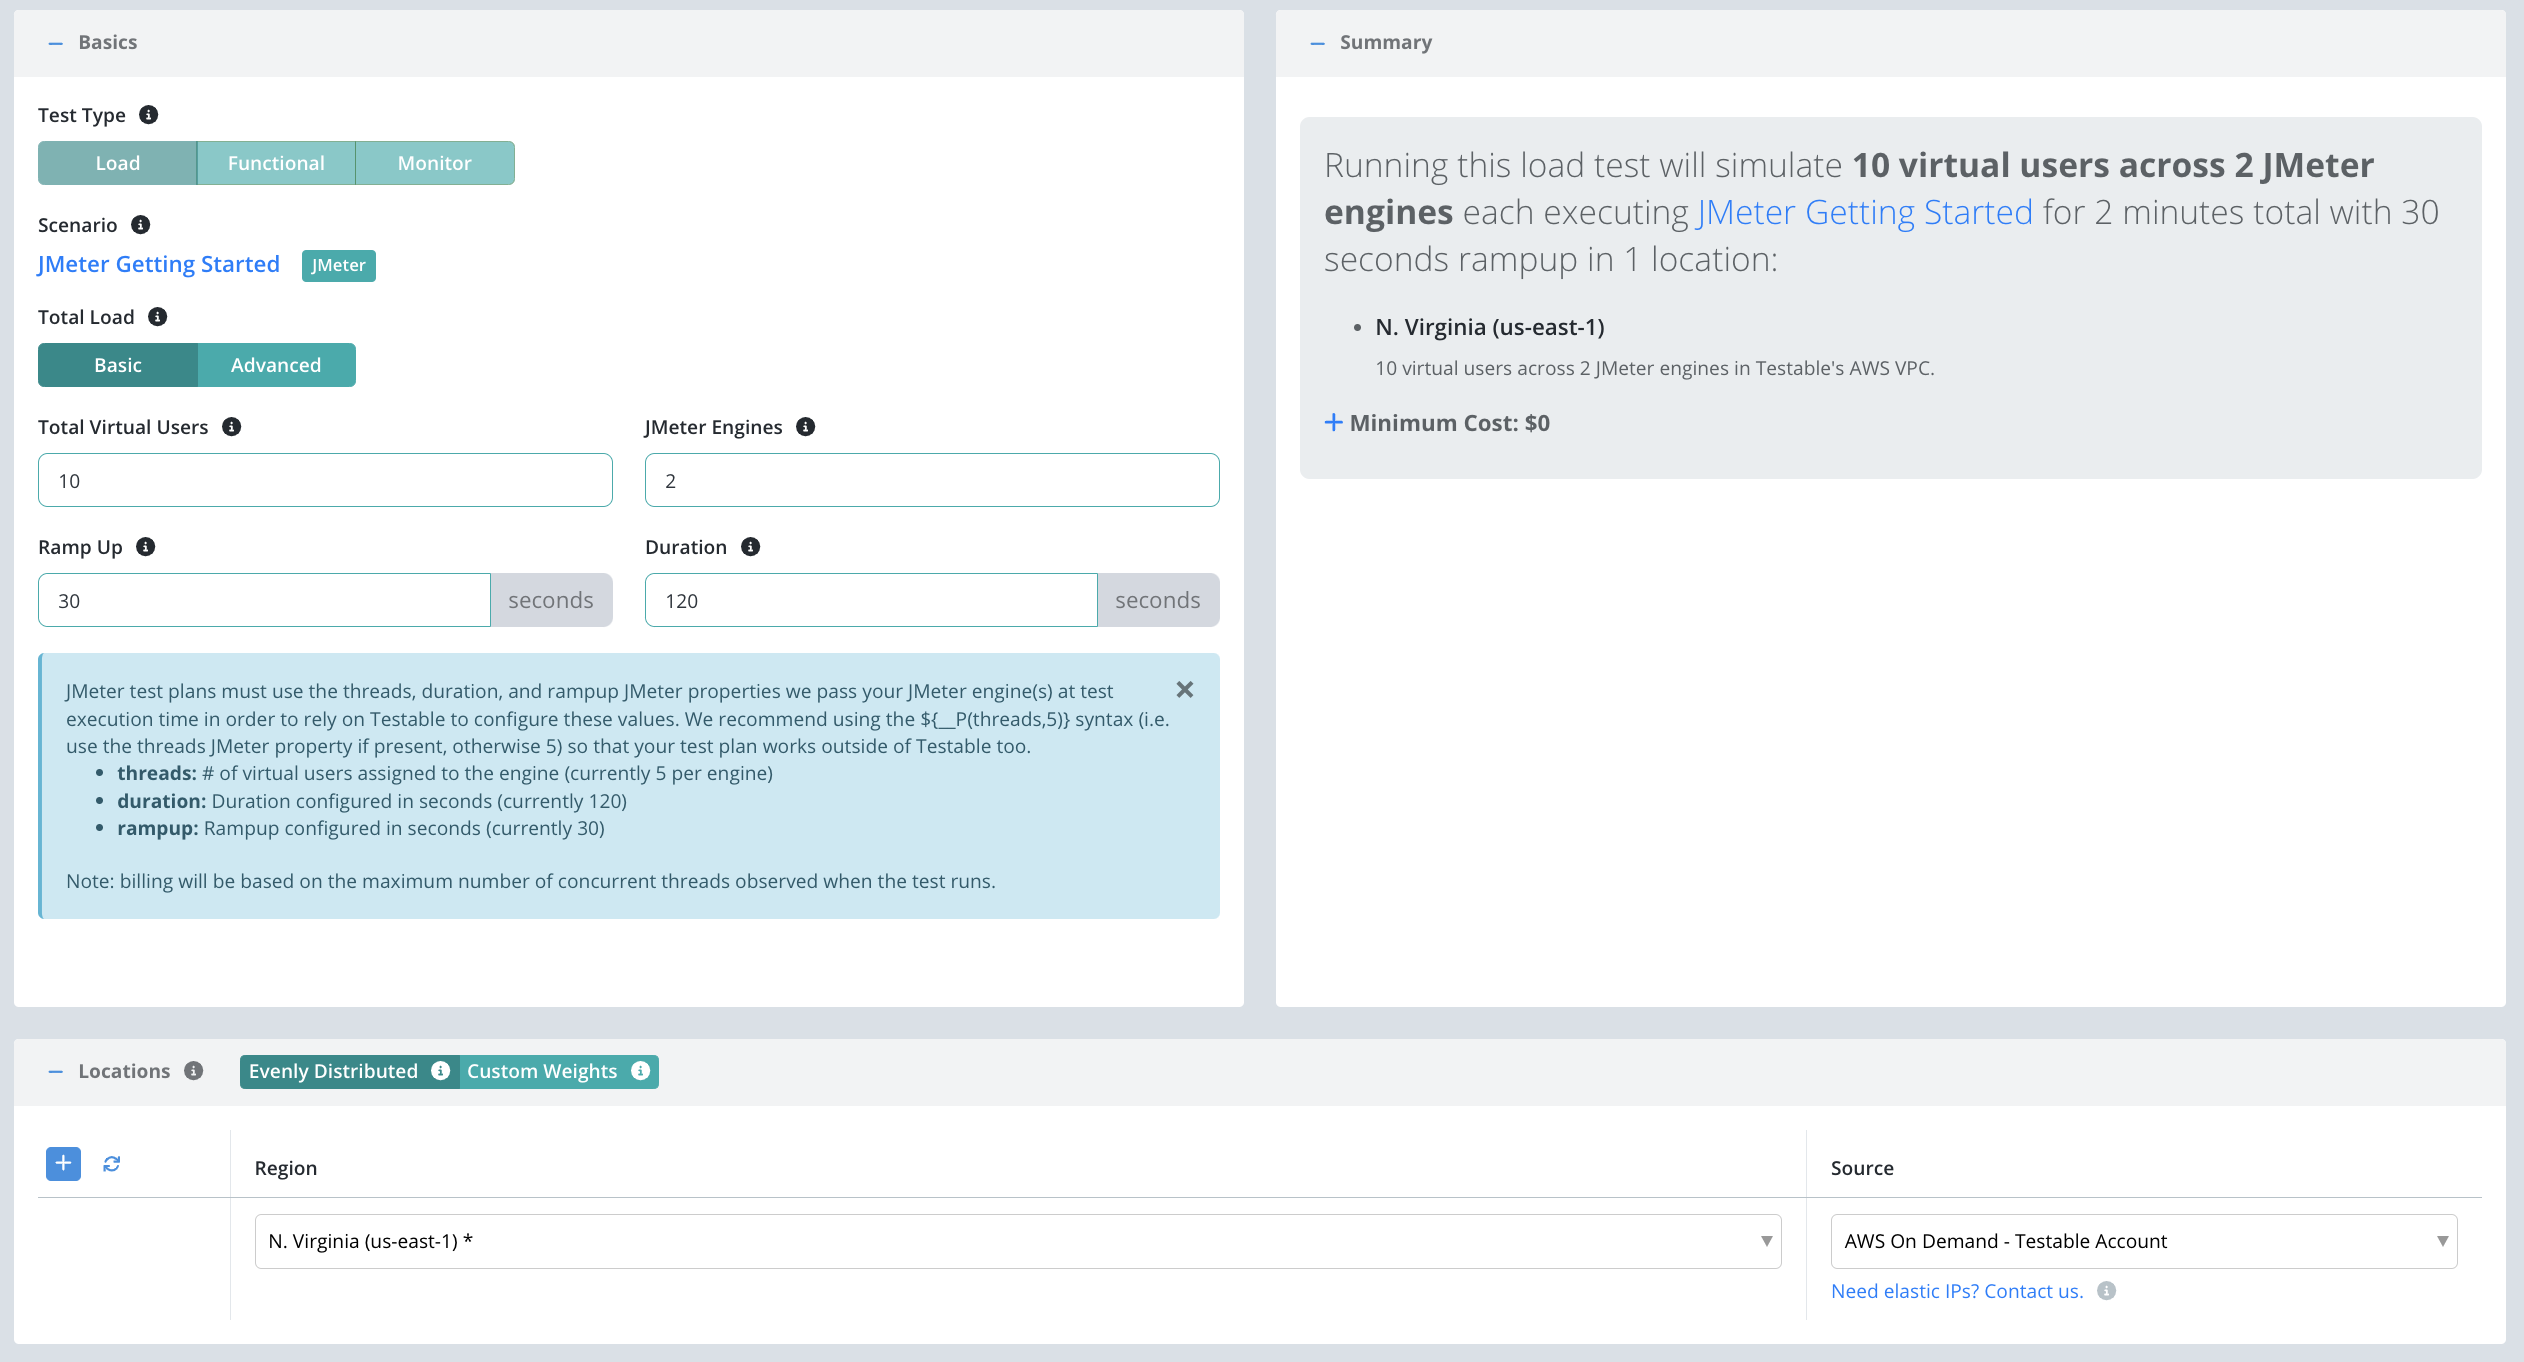
- Total Load: We will choose
Basichere and specify the total virtual users, # of JMeter engines, rampup and duration via the Testable UI and Testable will pass the right value forthreads,duration, andrampupto each JMeter engine. Alternatively, chooseAdvancedand simply specify how many JMeter engines to spin up with the load parameters either hard-coded into the thread group(s) or configured via scenario params. - Location(s): Choose the location in which to run your test and the test runner source that indicates which test runners to use in that location to run the load test. In this case we’ll choose AWS N. Virginia as the region and AWS On Demand - Testable Account as the source of test runner instances.
And that’s it! Press Start Test and watch the results start to flow in. See the new configuration guide for full details of all configuration options.
For the sake of this example, let’s use the following parameters:
View Results
Once the test starts executing, Testable will distribute the work out to the selected test runners (e.g. Public Shared Grid in AWS N. Virginia).
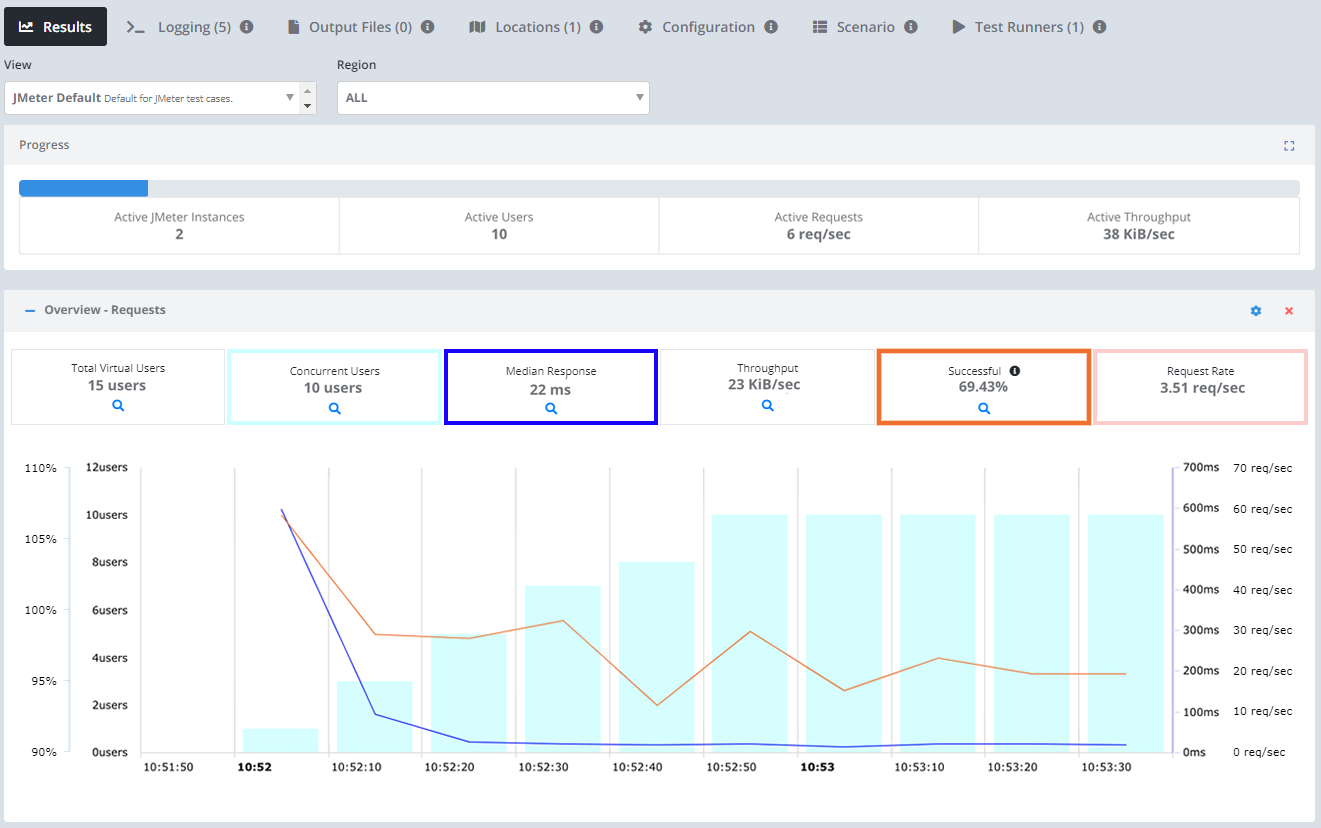
In each region, the Testable runners execute 2 JMeter instances. Our example test plan runs for 5 minutes with 5 threads.
You can see various graphs, metrics, and grids in the results. If you click on any resource in the results grid, the charts below will update to be specific to that resource only.
Check out the JMeter guide for more details on running your JMeter tests on the Testable platform.
We also offer integration (Org Management -> Integration) with third party tools like New Relic. If you enable integration you can do more in depth analytics on your results there as well.
That’s it! Go ahead and try these same steps with your favorite website or API and feel free to contact us with any questions.