Playwright Remote Testing
- Introduction
- Architecture
- Playwright Test + Testable
- Playwright Library + Testable
- Traces
- Testable Commands
Introduction
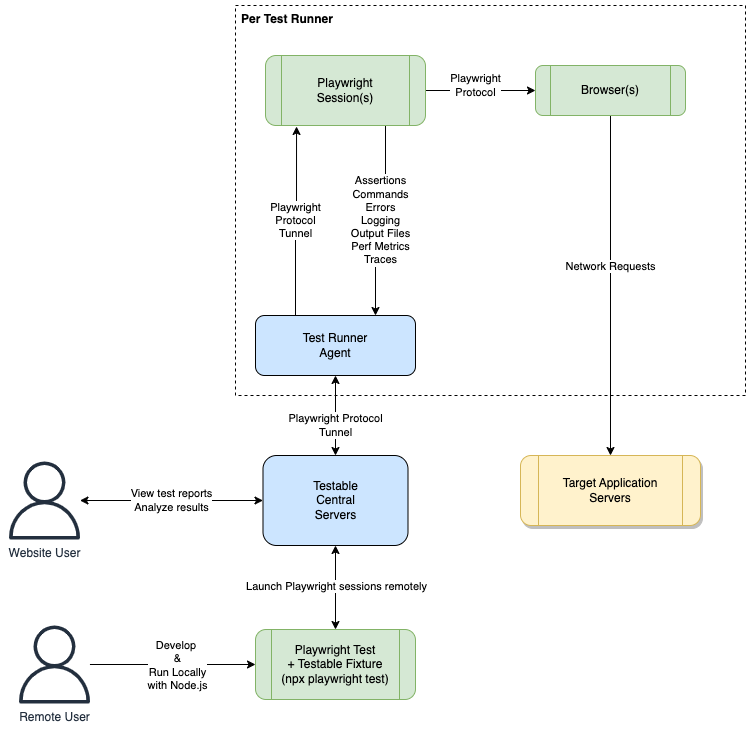
You can use the Testable platform as a remote browser grid for Playwright tests. Each Playwright session will run on a Testable test runner according to the options you provide when connecting. This includes support for all Cloud providers, in your account or ours, as well as self-hosted test runners.
This works with both Playwright Library and Playwright Test.
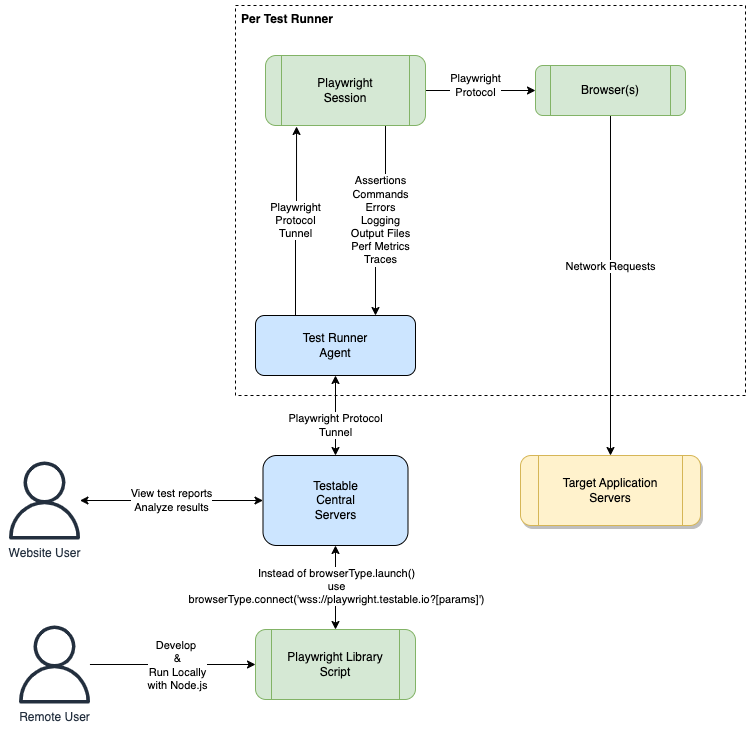
Architecture
Playwright Test
Playwright Library
Playwright Test + Testable
You can take any existing Playwright Test suite and run it on Testable with only one change in your playwright.config.ts file to connect it to Testable Cloud:
import { devices } from '@playwright/test';
import { defineConfig } from 'testable-playwright-test'

export default defineConfig({
  // config goes here like normal ...
  testDir: './tests',
  // ...
}, {
  // API key (Org Management => API Keys)
  key: 'xxxxxxxxx',
  // Gets logged with the test indicating which user ran this test, defaults to 'remote'
  user: 'demo',
  // The region in which to run your test
  region: 'aws-us-east-1',
  // Whether to capture an automatic screenshot after each test step (afterEvery) or after failed test steps (afterFailed)
  screenshot: 'afterFailed',
});
Playwright Library + Testable
The Testable Cloud remote Playwright grid can be accessed at:
wss://playwright.testable.io
For Testable Enterprise the url is similar but instead of playwright.testable.io you should use either the address of the coordinator-service with path /playwright or whatever DNS alias for the coordinator-service is specified as TESTABLE_PLAYWRIGHT_URL.
The easiest way to learn about all the possible parameters is by logging into your Testable account and going to the Remote Test Configurator.
Example:
const { chromium } = require('playwright');
const { URLSearchParams } = require('url');

(async () => {
    try {
        const params = new URLSearchParams({
            // API key (Org Management => API Keys)
            key: process.env.TESTABLE_KEY,
            // Browser name: chromium, webkit, firefox, chrome, edge
            browserName: 'chrome'
        }).toString();
        const browser = await chromium.connect(
            `wss://playwright.testable.io?${params}`,
            { timeout: 0 });
        const page = await browser.newPage();
        // ...
        await browser.close();
    } catch (err) {
        console.log(err);
    }
})();
Available Parameters:
-
key[MANDATORY]: A valid API key for your account found after logging in under Org Management => API Keys. -
browserName: Which browser to use. Supported list ischromium,webkit,firefox,chrome,edge. -
region: A valid Testable region name in which to run your test. This can be either a long runner or per test region. or our test runners doc for more details. If not specified one will be chosen for you based on availability. -
source: To use an on demand test runner provide the name here. This can either be a Testable cloud account ([AWS|Azure|GCP] - Testable Account) or any source that you configure for your own cloud accounts. Use the configurator to learn more about the cloud specific options that correspond to each cloud provider (e.g. vpc, subnet, etc). -
deviceName: Either the name of one of the devices that Testable supports or a custom device. Use the configurator to find the current list and format for custom devices. -
testCaseName: The test case in which to record the Selenium session as a test run. Defaults toRemote Selenium Test. You can also specifytestCaseFolderif you want the test case to go inside a folder (/by default –/Folder1/Nested2for example) -
scenarioName: The scenario name to capture the options and capabilities corresponding to your session. Defaults toRemote Selenium. -
name: The test configuration name for test history tracking purposes. Sessions with the samenamewill be part of a single test history that includes test pass rate, metrics, etc. Defaults to[BrowserName] - [Device]. -
recordVideo: Whether or not to capture a video of the test run. Defaults totrue. -
playwrightVersion: Should match the version of Playwright you are using. If not specified, defaults to the version which supports the browser version chosen. -
capturePerformance: Whether or not to capture network request metrics from the browser for every HTTP request. Defaults totrue. -
captureBody: Whether or not to capture the body of every network request and include it in the test result network traces. Impacts test performance. Defaults tofalse. -
captureConsoleLog: Whether or not to capture the browser console log as part of the test results logging. Defaults totrue. -
user: A name to log as part of the test results for tracking purpose. Defaults toremote. -
openfinConfigUrl: For OpenFin application testing you must specify the URL of your application config json. -
logCommands: Whether or not to log all commands sent at the Playwright protocol level. Defaults tofalse. -
logEvents: Whether or not to log all events generated by Playwright at the protocol level. Defaults tofalse. -
billingStrategy: A billing related setting for how to decide when to run your test. Defaults toMinimizeCost. Other possible value isASAP. -
billingCategories: When billing strategy is ASAP, this parameter can be specified as a comma separated list of plan types. When there are multiple ways to bill your test this setting will help decide which plan to choose (possible values = TestRunner, VU, Monitor, BrowserSession, LiveSession).
Traces
If your test captures a Playwright trace it will be available in the output files tab of the test run report.
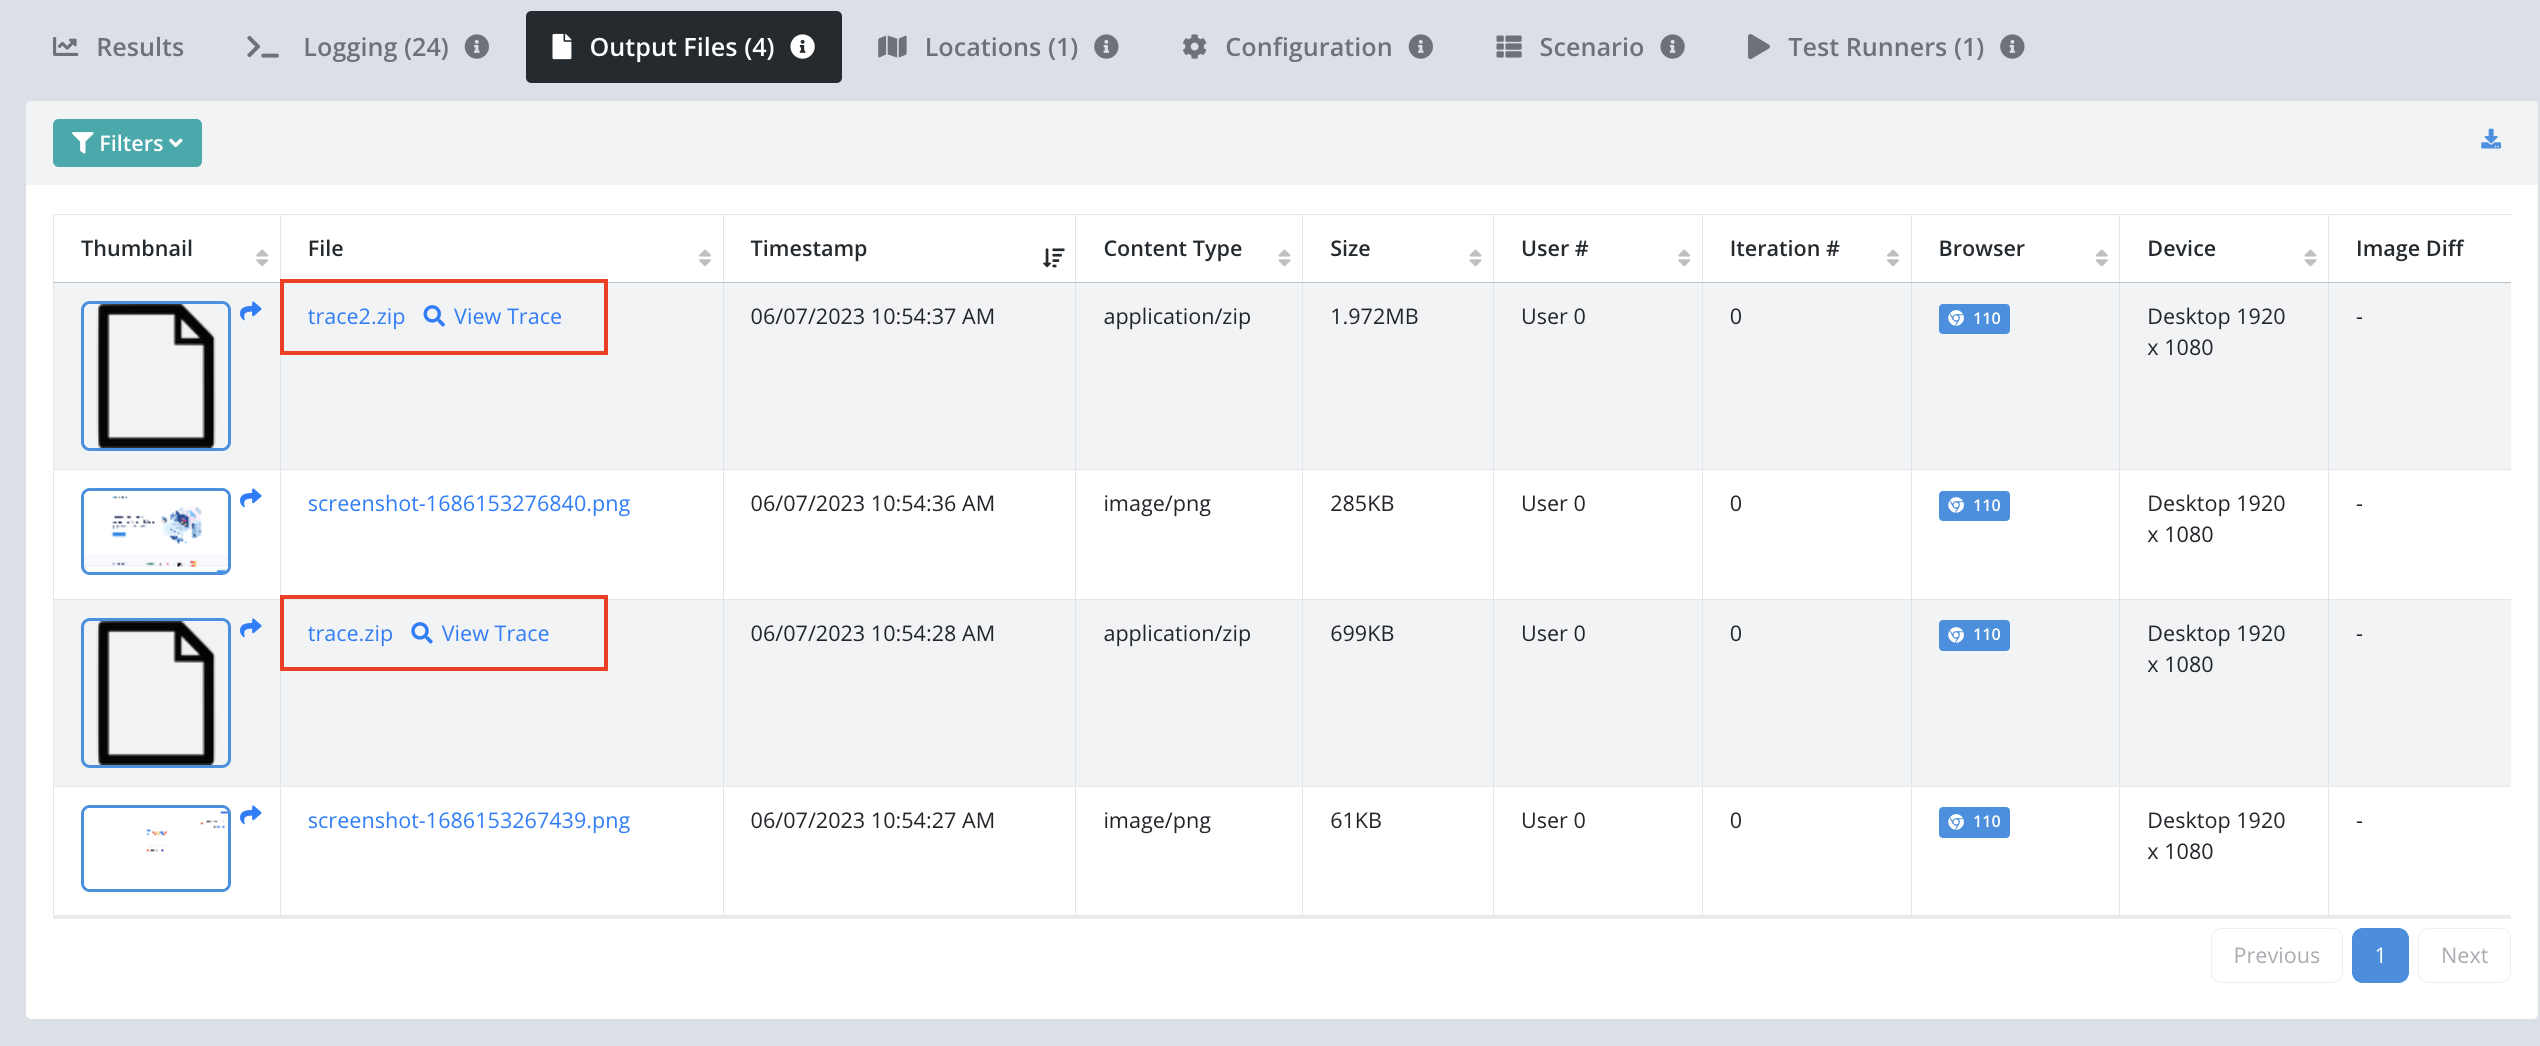
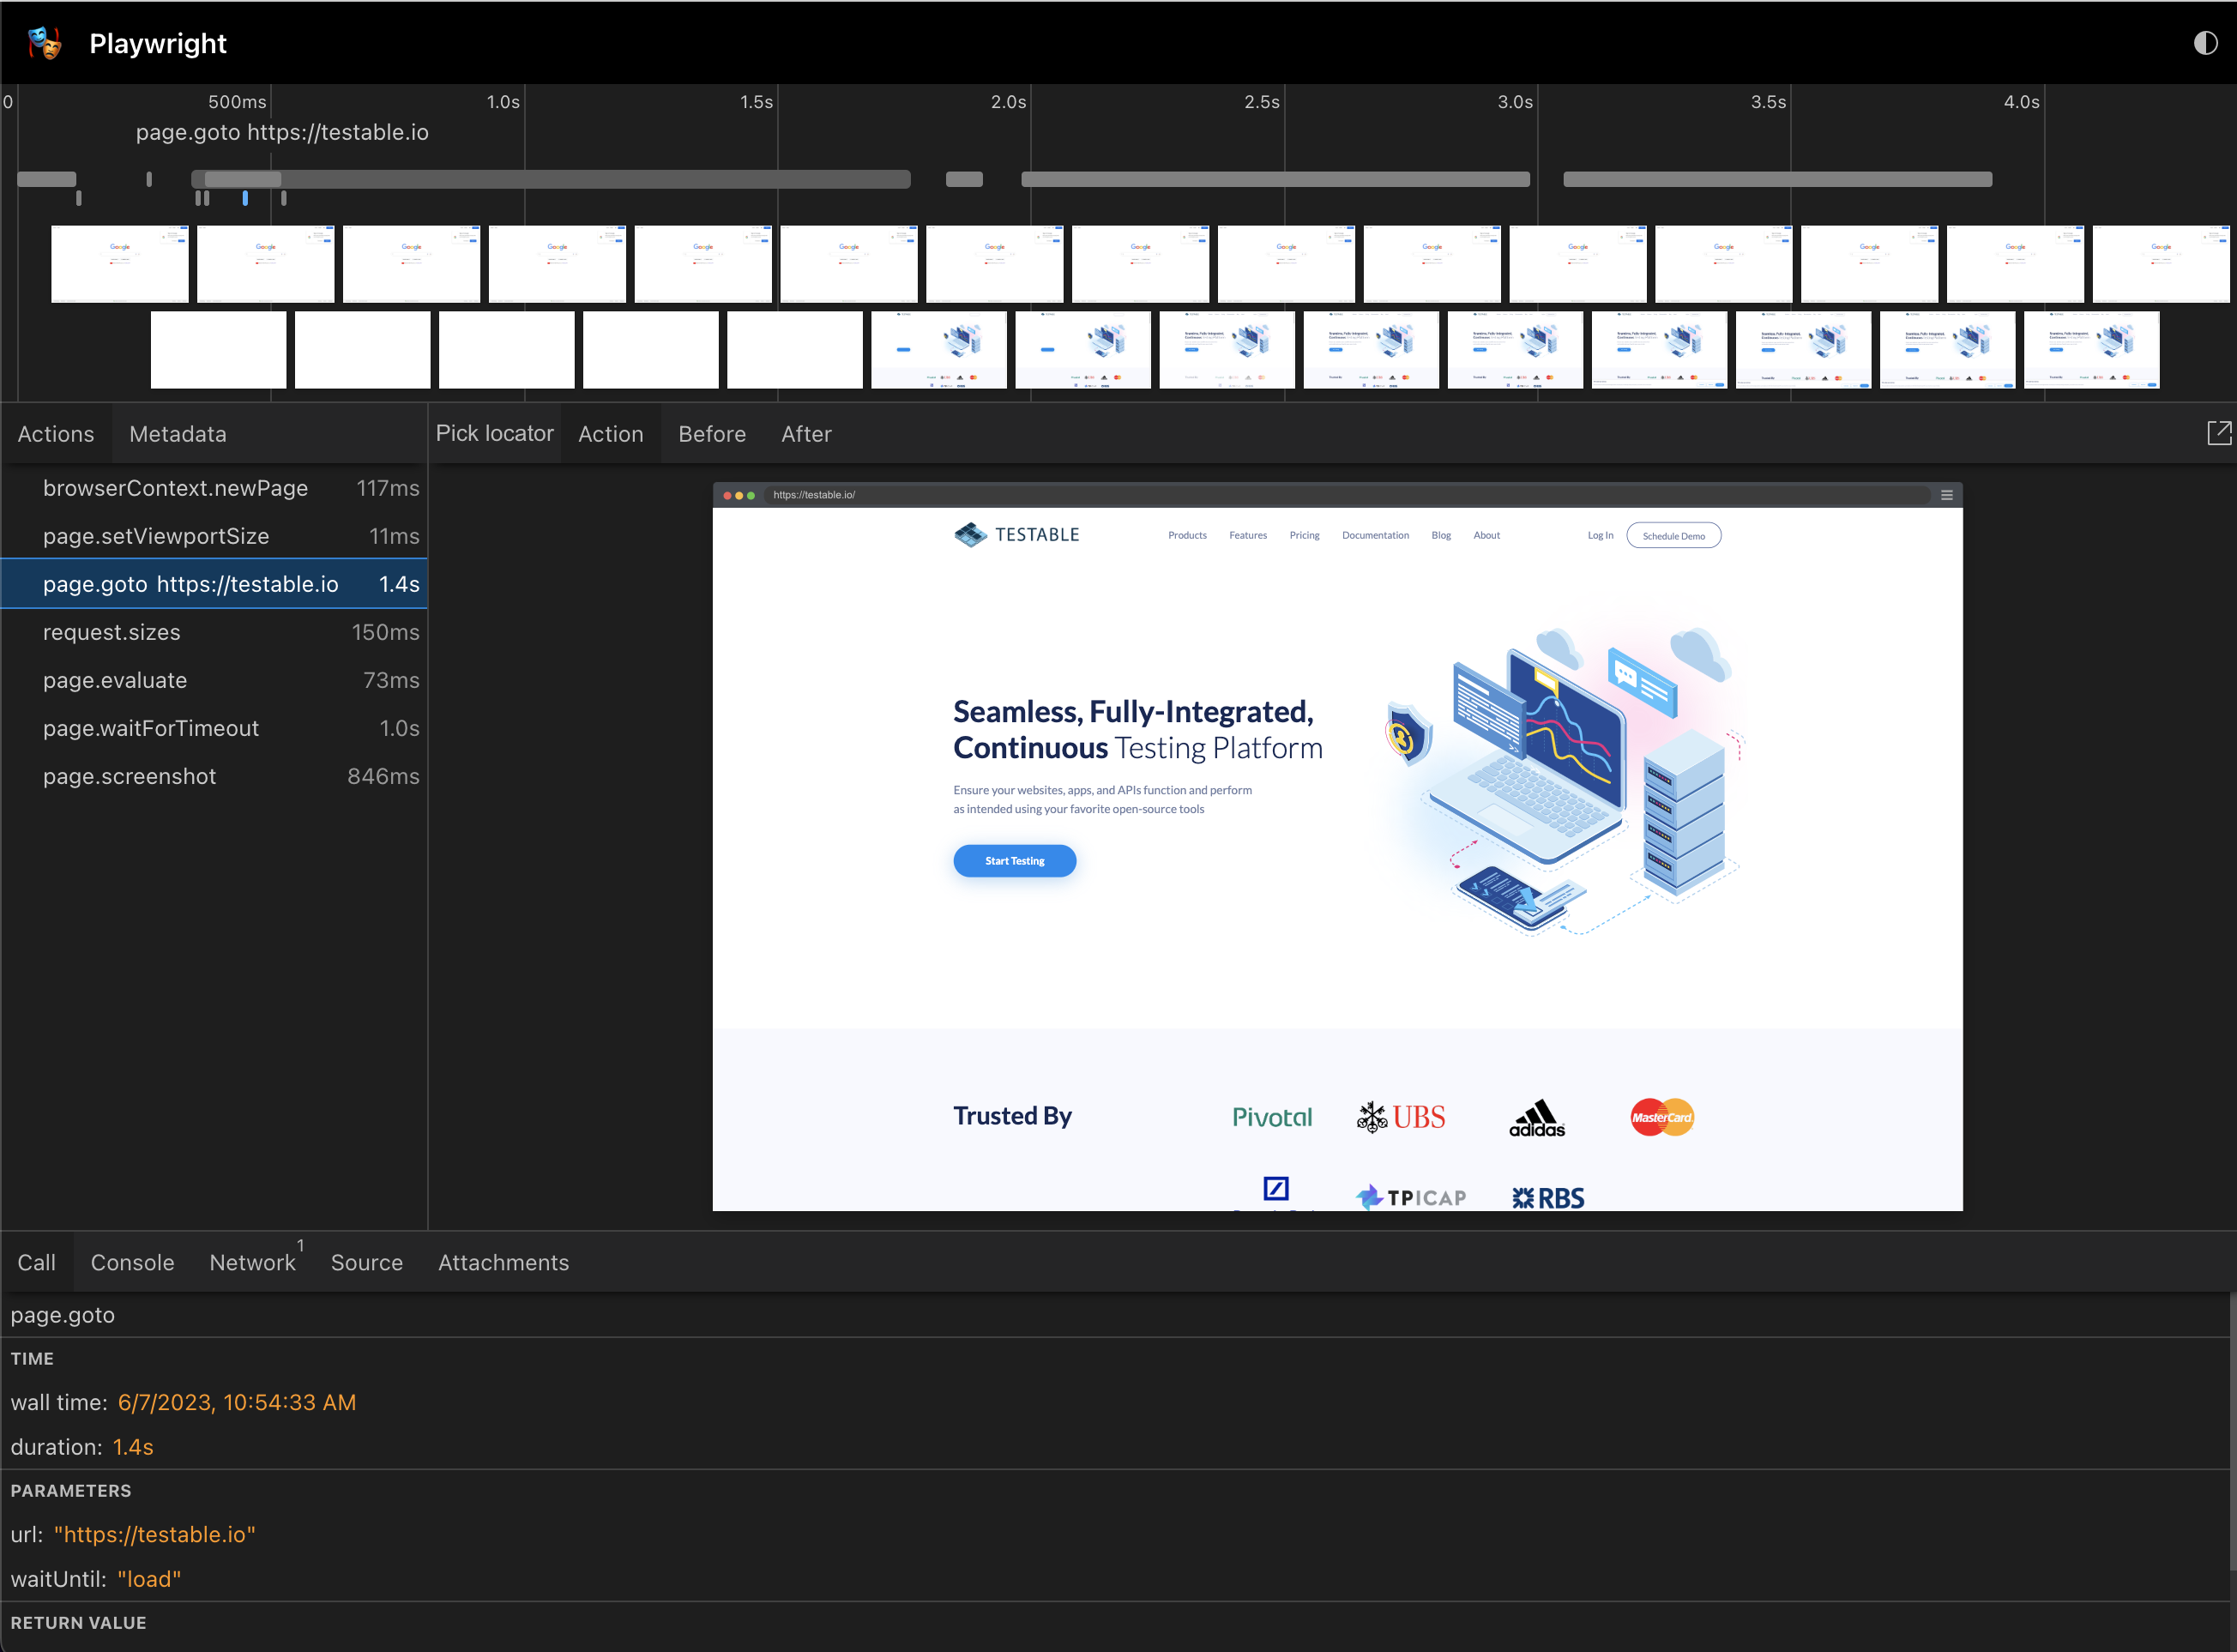
You can also click on any trace and view it in the Playwright trace viewer.
Commands
We use Playwright’s page.evaluate(func, args) API to introduce some Testable specific functionality.
Testable Information (testable_info)
Get information about the Testable session including the session id that can be used to reconnect to the same session and the corresponding execution id that you can use to view the test results via the web application, both live and after the test runs.
// result structure: { executionId, sessionId }. Use this to view test results live: https://a.testable.io/results/[executionId] or the sessionId param to reconnect with the same session.
const info = await page.evaluate(function testable_info() {});
Custom Metrics (testable_metric)
await page.evaluate(function testable_metric() { }, [ 'timing'|'counter'|'histogram'|'metered', { name[, key], val, units } ]);
Report custom metrics that are visualized as part of your test report on Testable. Read more about the different metric types here.
timing
// capture a timing called "Order Execution Time" that is visible in the test results
await page.evaluate(function testable_metric() { }, [ 'timing', { name: 'Order Execution Time', val: 342, units: 'ms' } ]);
counter
// capture a counter "Orders Placed" that is visible in the test results
await page.evaluate(function testable_metric() { }, [ 'counter', { name: 'Orders Placed', val: 5, units: 'orders' } ]);
histogram
// capture a histogram "Orders By Type" that is visible in the test results
await page.evaluate(function testable_metric() { }, [ 'histogram', { name: 'Orders By Type', key: 'Delivery', val: 1 } ]);
metered
// capture a metered metric "Server Memory Usage" that is visible in the test results
await page.evaluate(function testable_metric() { }, [ 'metered', { name: 'Server Memory Usage', val: 34524232, units: 'bytes' } ]);
Assertions (testable_assertion[_start|_finish])
// after finish
await page.evaluate(function testable_assertion() { }, { suite, name, duration, state[, errorType, error, errorTrace] });

// streaming
await page.evaluate(function testable_assertion_start() { }, { suite, name });
// ...
await page.evaluate(function testable_assertion_finish() { }, { suite, name, state[, duration, errorType, error, errorTrace] });
Send assertions to be included as part of the test results.
After Finish (testable_assertion)
Use testable_assertion to capture an assertion after it has completed. It will appear in real-time in the test results Assertions widget.
await page.evaluate(function testable_assertion() { }, {
  suite: 'My Test Suite',
  name: 'Should place order',
  duration: 1423,
  state: 'passed'
});
Or with an error:
await page.evaluate(function testable_assertion() { }, {
  suite: 'My Test Suite',
  name: 'Should place order',
  duration: 1423,
  state: 'failed',
  errorType: 'BACKEND_ERROR',
  error: 'Failed to connect to order placement service',
  errorTrace: '...stacktrace...'
});
Streaming (testable_assertion_[start|finish])
Use streaming assertions to indicate when a test step starts and finishes. As soon as the start command is received the assertion will appear as in progress in the test results. Once the finish message is received or the test ends, the assertion will be marked as finished.
Only one assertion can be in progress at a time per test. It’s assumed the finish message relates to the most recently started assertion. If a start message is received while a previous assertion is active, the previous assertion will be marked as finished.
await page.evaluate(function testable_assertion_start() { }, { suite: 'My Suite', name: 'Place an order' });

// ...

// passed
await page.evaluate(function testable_assertion_finish() { }, { state: 'passed' });

// failed
await page.evaluate(function testable_assertion_finish() { }, {
  state: 'failed',
  errorType: 'BACKEND_ERROR',
  error: 'Failed to connect to order placement service',
  errorTrace: '...stacktrace...'
});
Pass/Fail Test (testable_[pass|fail])
Mark the entire test run as having passed or failed. Testable will show you the P/F status in the test report and also track the P/F history over time to provide pass rate trends and allow you to track it against your SLAs.
await page.evaluate(function testable_[pass|fail]() { }, [ 'Optional message indicating why the test passed or failed' ]);
Logging (testable_log)
Write a message into the Testable report log. This will be visible in the Logging tab of the test results.
await page.evaluate(function testable_log() {}, [ 'fatal'|'error'|'info'|'debug', msg ]);
For example:
await page.evaluate(function testable_log() {}, [ 'info', 'Order was placed for 2 items totalling $12.82 with no issues' ]);