View Test Results
Introduction
If you have previously gone through the steps to Execute a Test it is quite easy to pull up the results again. Make sure you first login and in the Test Cases grid click on the ‘Last Test Execution => Started’ column on any test it will pull up the most recent result.
To see historic results click on the test configuration name and then select the run of interest from the page that loads.
Each tab on the results page will be broken down in detail here.
Results Tab
The Results tab is customizable and contains the following possible widgets.
Filters
Test results can be filtered on the following dimensions:
- Time: Use the slider along the top of the test results to zoom in on a particular time interval during the test. All widgets will filter to that time period including charts, metrics, logging, images, etc.
- Region: If your test ran in multiple regions filter the results for just one particular region.
- Resource: Filter all widgets to show results for one specific resource. This includes all metrics and charts. A resource is simply a label to aggregate on that can include URL, JMeter label, Gatling scenario name, etc.
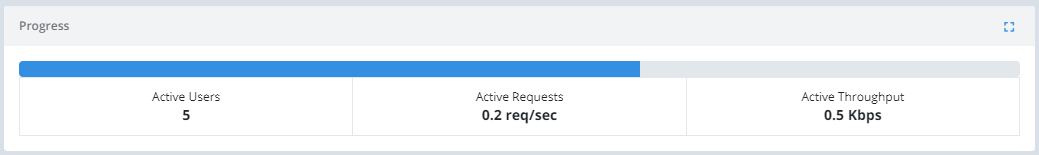
Execution Progress
While the test is executing, this section shows you some “active” metrics. Active means executed during the most recent interval.
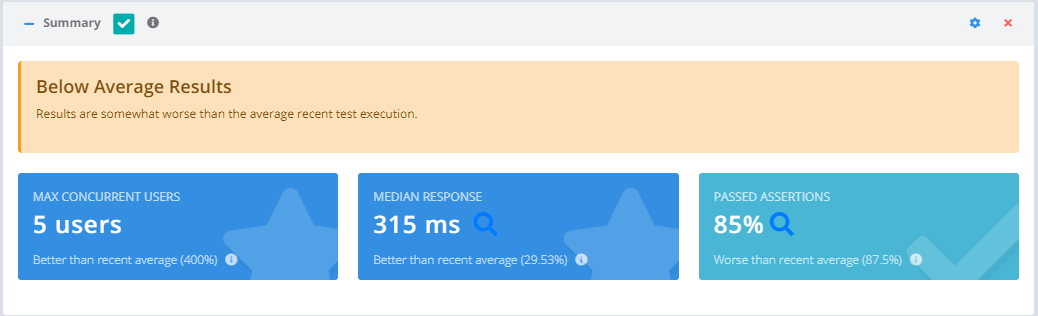
Summary
See a quick high level summary of how the results of this test execution compares with other recent runs of this same test configuration.
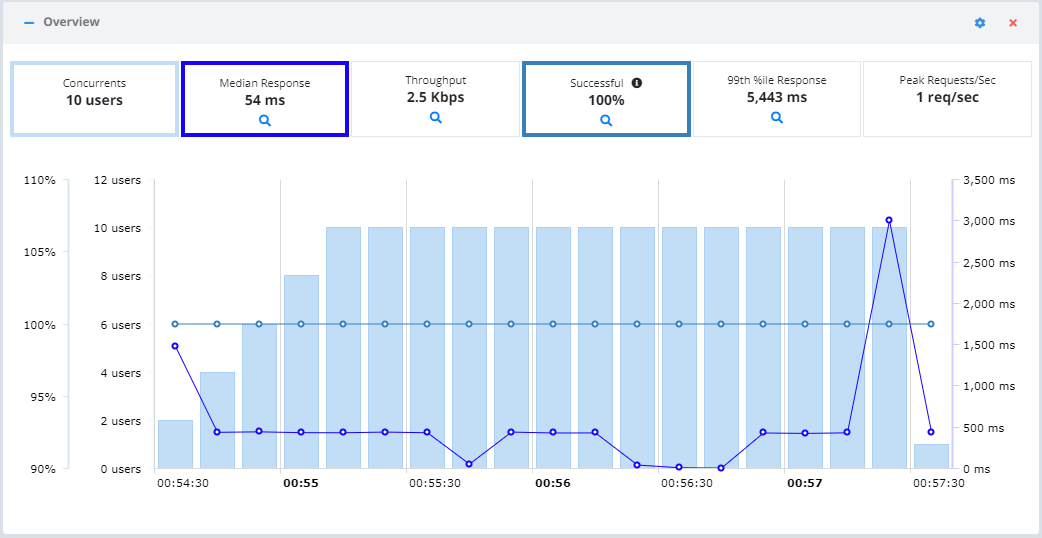
Overview
Metrics and a chart that give you an overview of performance during the test. Each metric can be toggled on/off on the chart. See how the results during this test compare with up to 10 recent test executions as both a percentage change and a sparkline to spot trends. The set of metrics shown is customizable as well.
Images
The images widget shows you the most recent screenshots captured while running your test. Tools like Webdriver.io, Protractor, Selenium Java, Selenium Javascript, PhatnomJS, and SlimerJS support screenshot capture and these will appear here in a gallery layout.
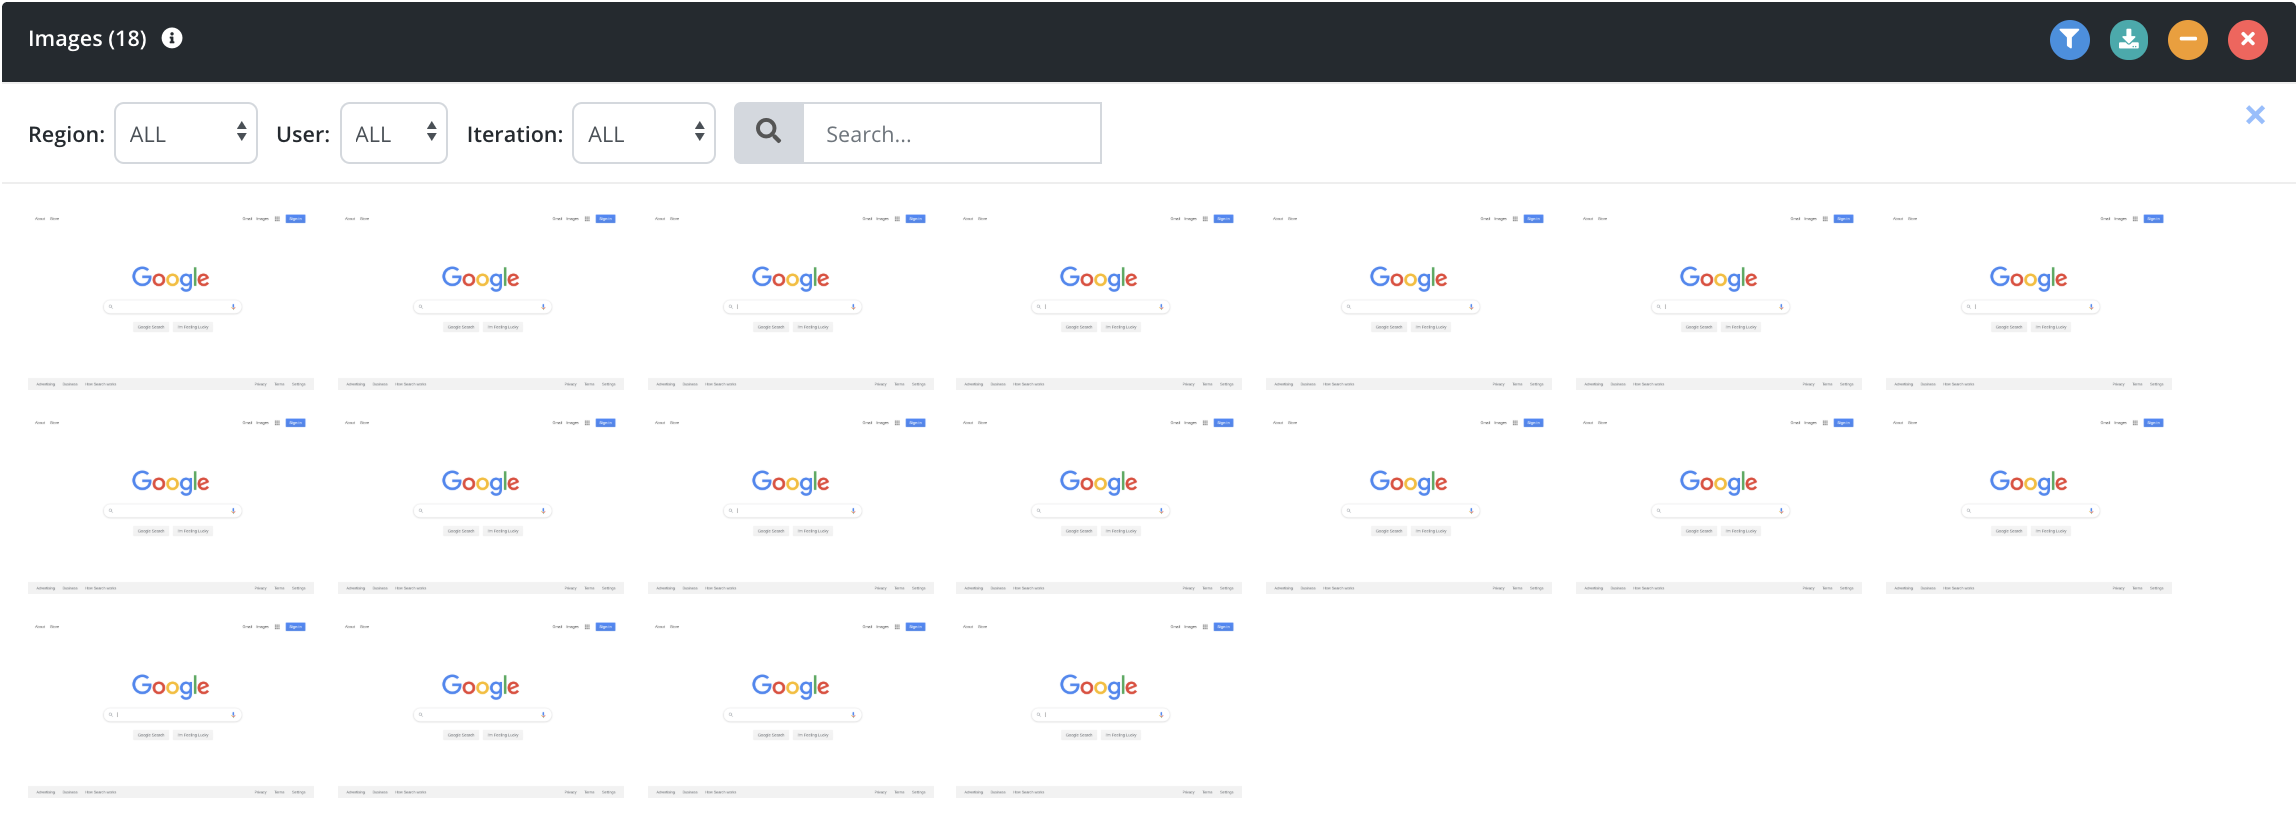
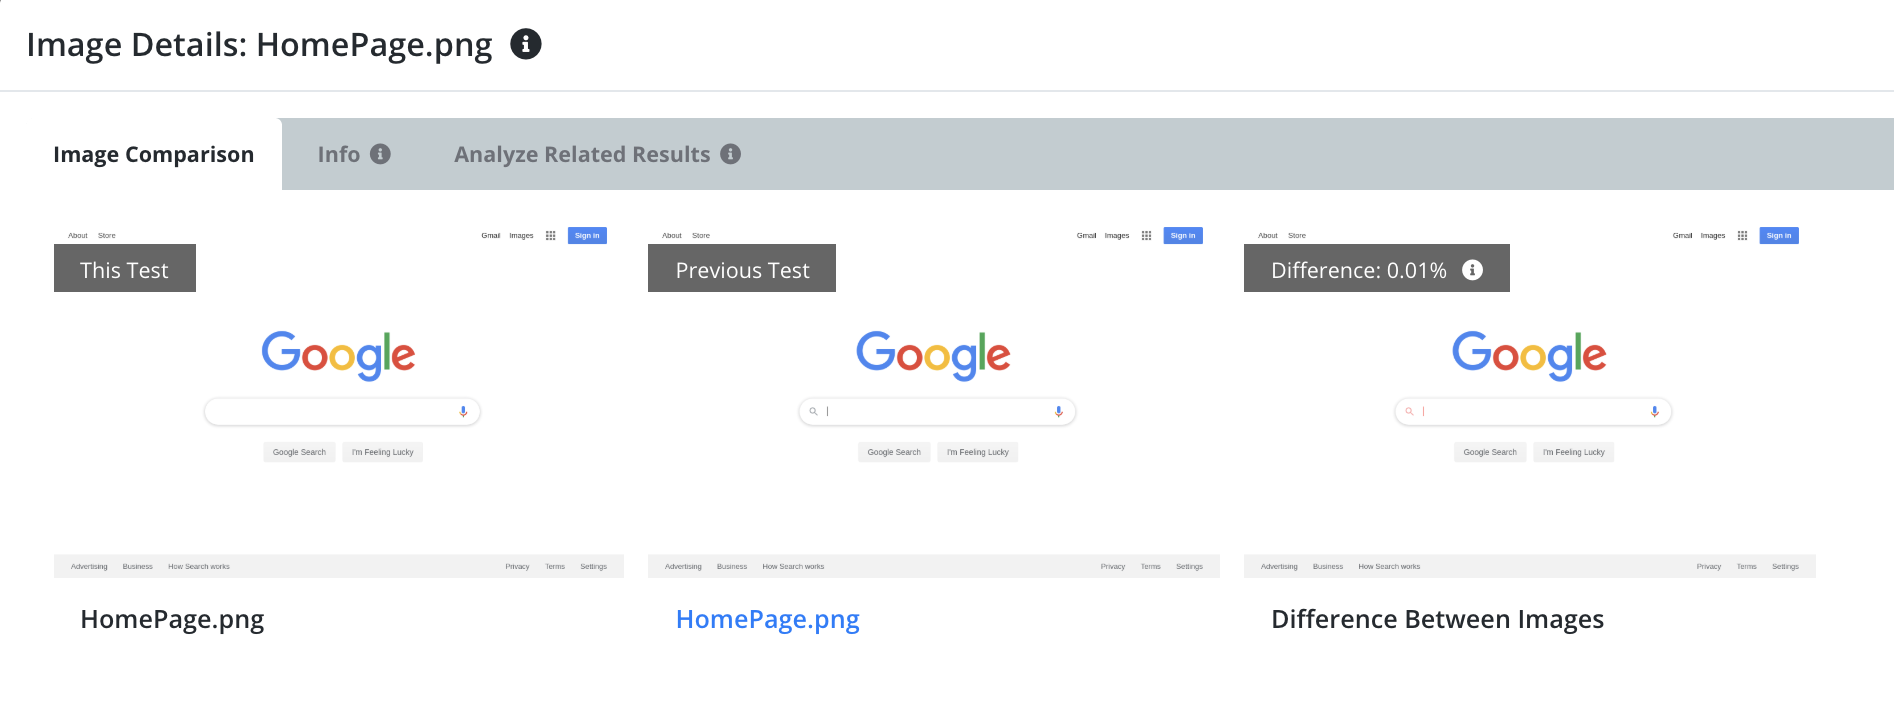
Click on any image to see it full sized, compare it visually to previous runs of this test, and see related assertions/results/screenshots captured during the same test iteration.
See the new configuration documentation for more details on configuring image diffing.
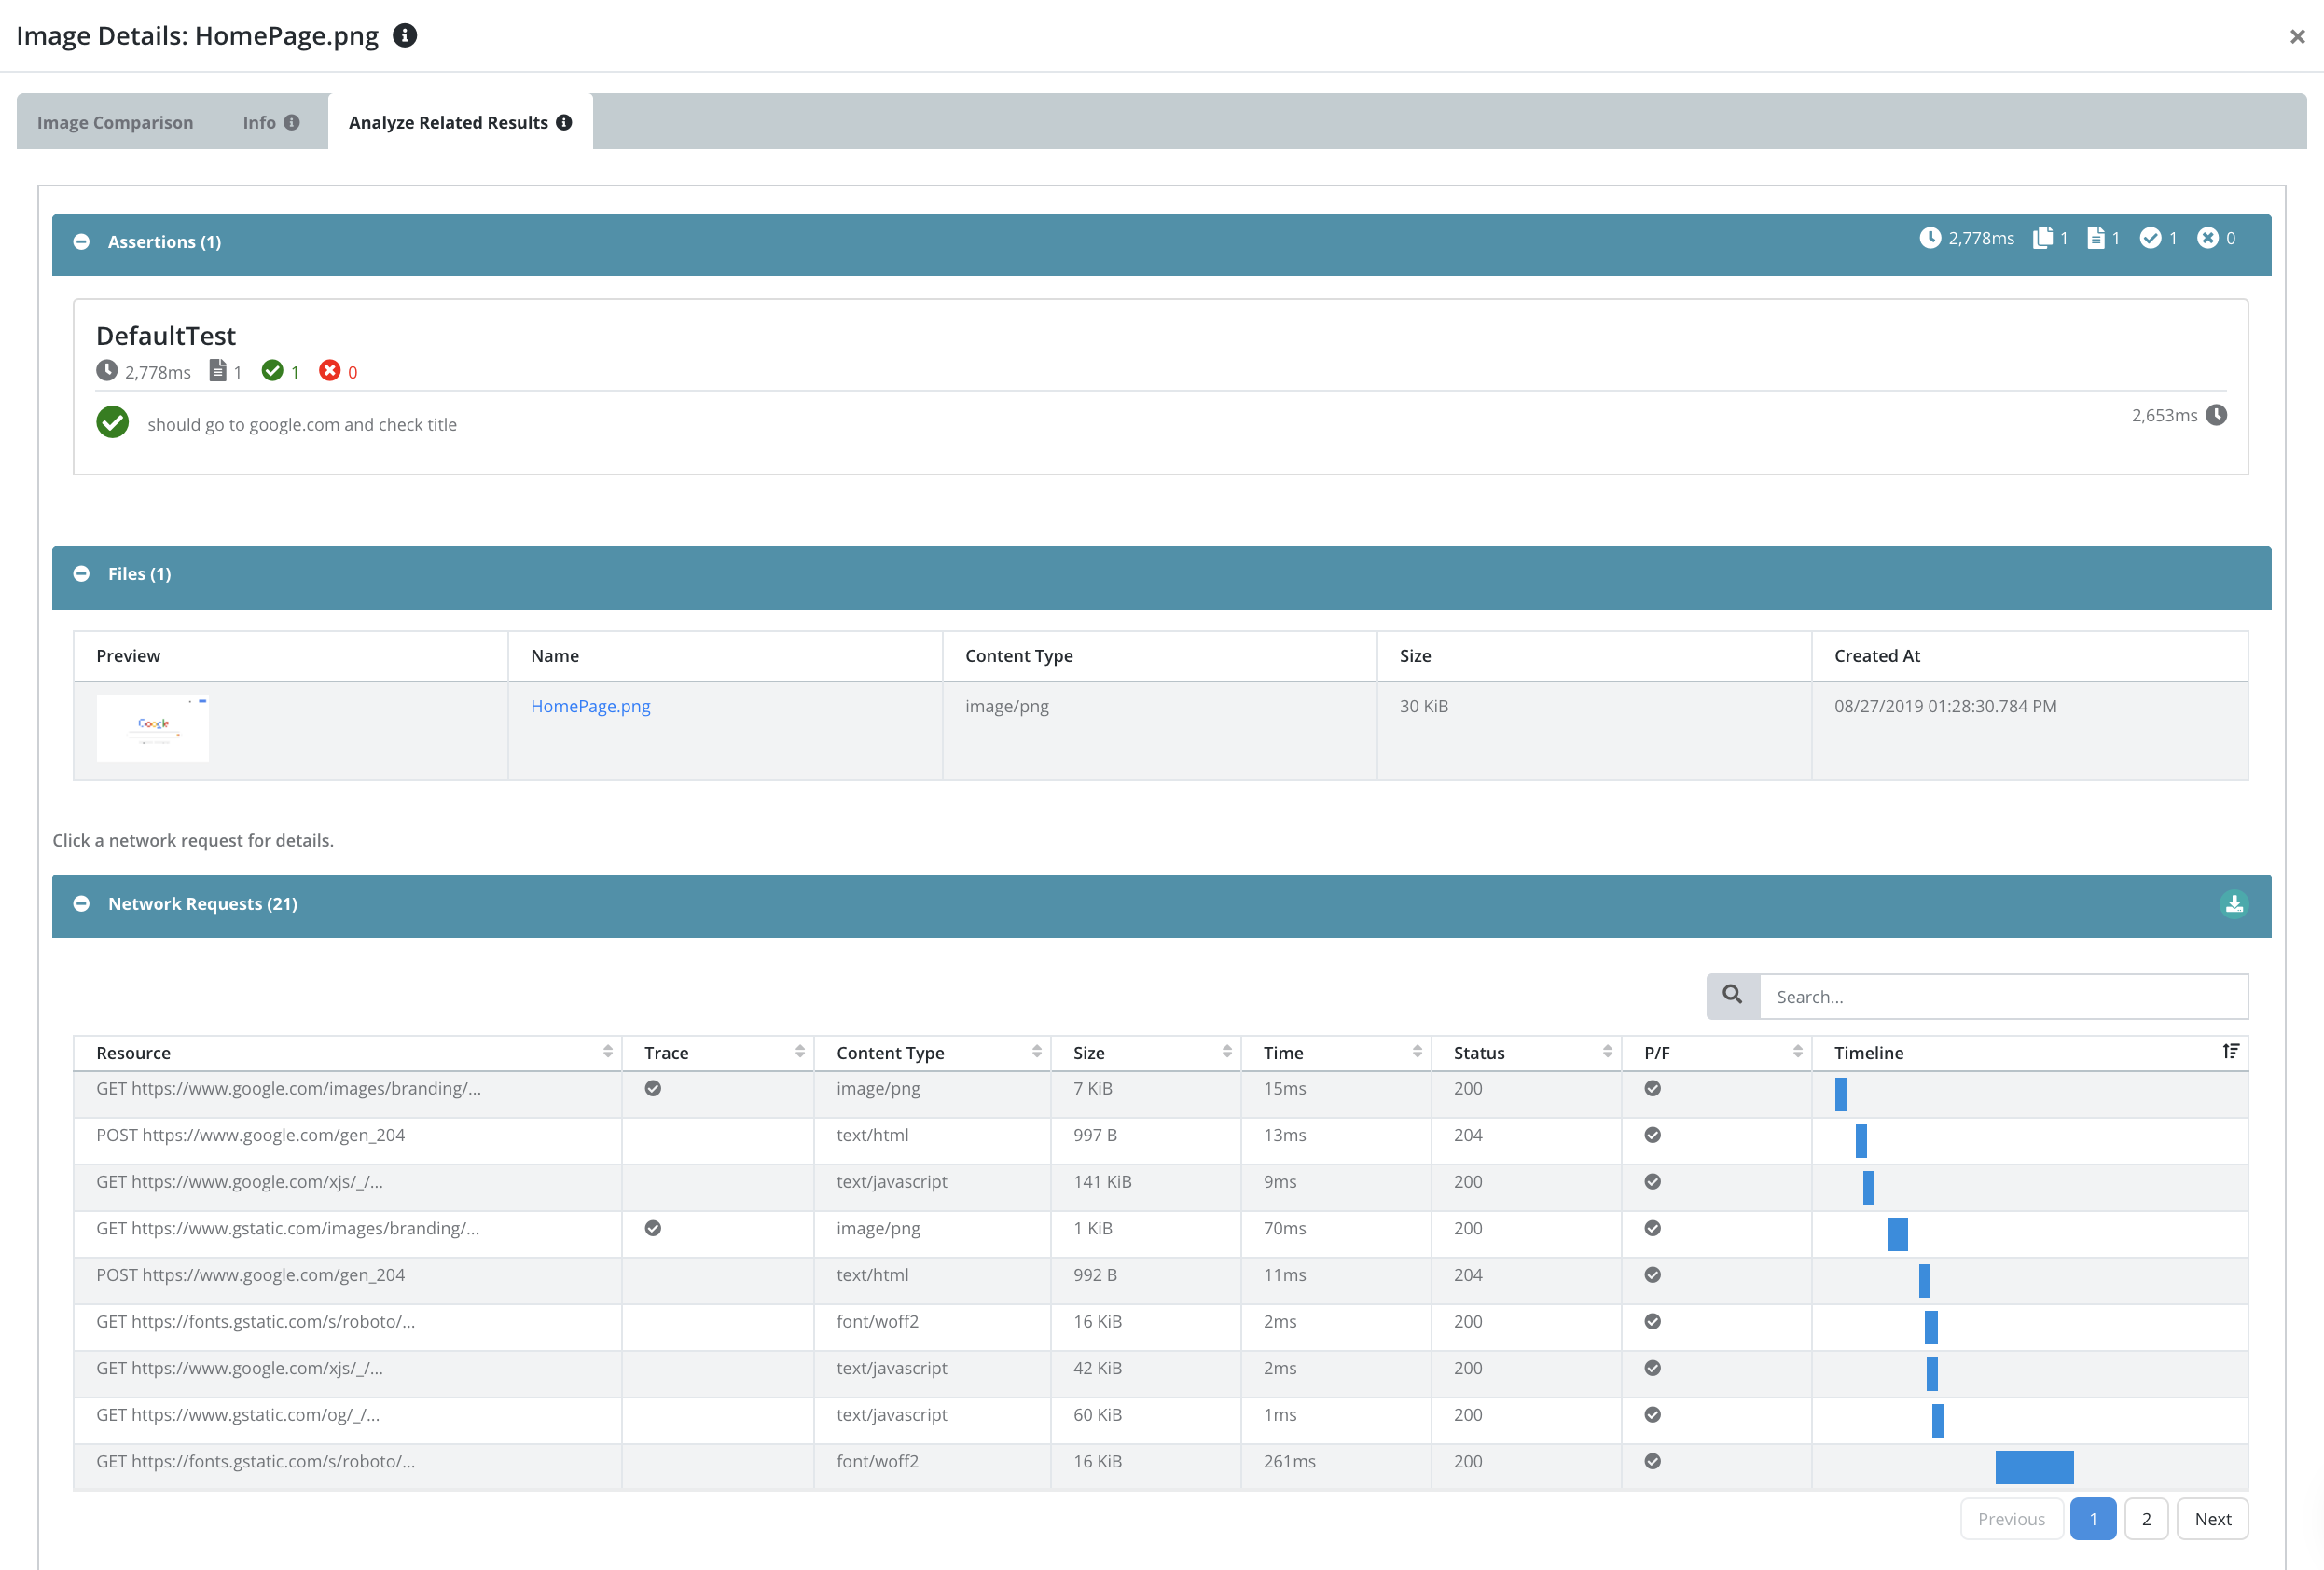
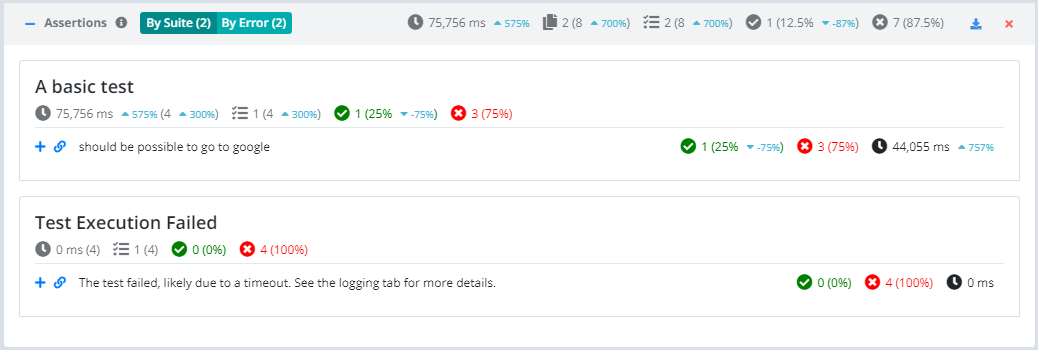
Assertions
For scenarios that capture assertion results like Webdriver.io + Mocha, Selenium Javascript + Mocha, and JMeter this widget displays a summary of the test suite results including a listing of all suites, tests, average duration, errors, etc.
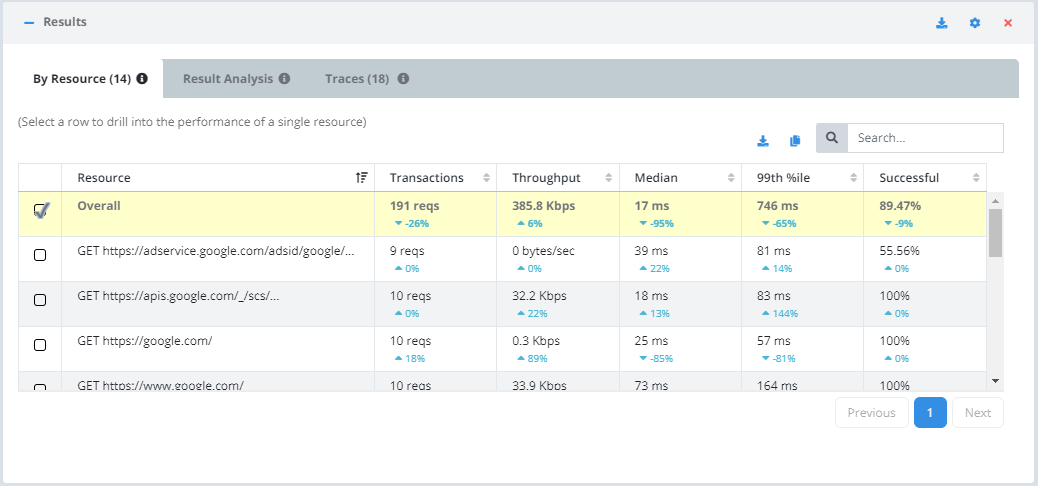
Results
The results are broken down by resource. A resource usually corresponds to a network resource like GET https://www.google.com, a JMeter Label, or a Gatling scenario name + request label, but can also be anything captured with a custom metric. The columns in this grid are customizable.
If you select a resource in the grid, all charts and traces become specific to that resource only.
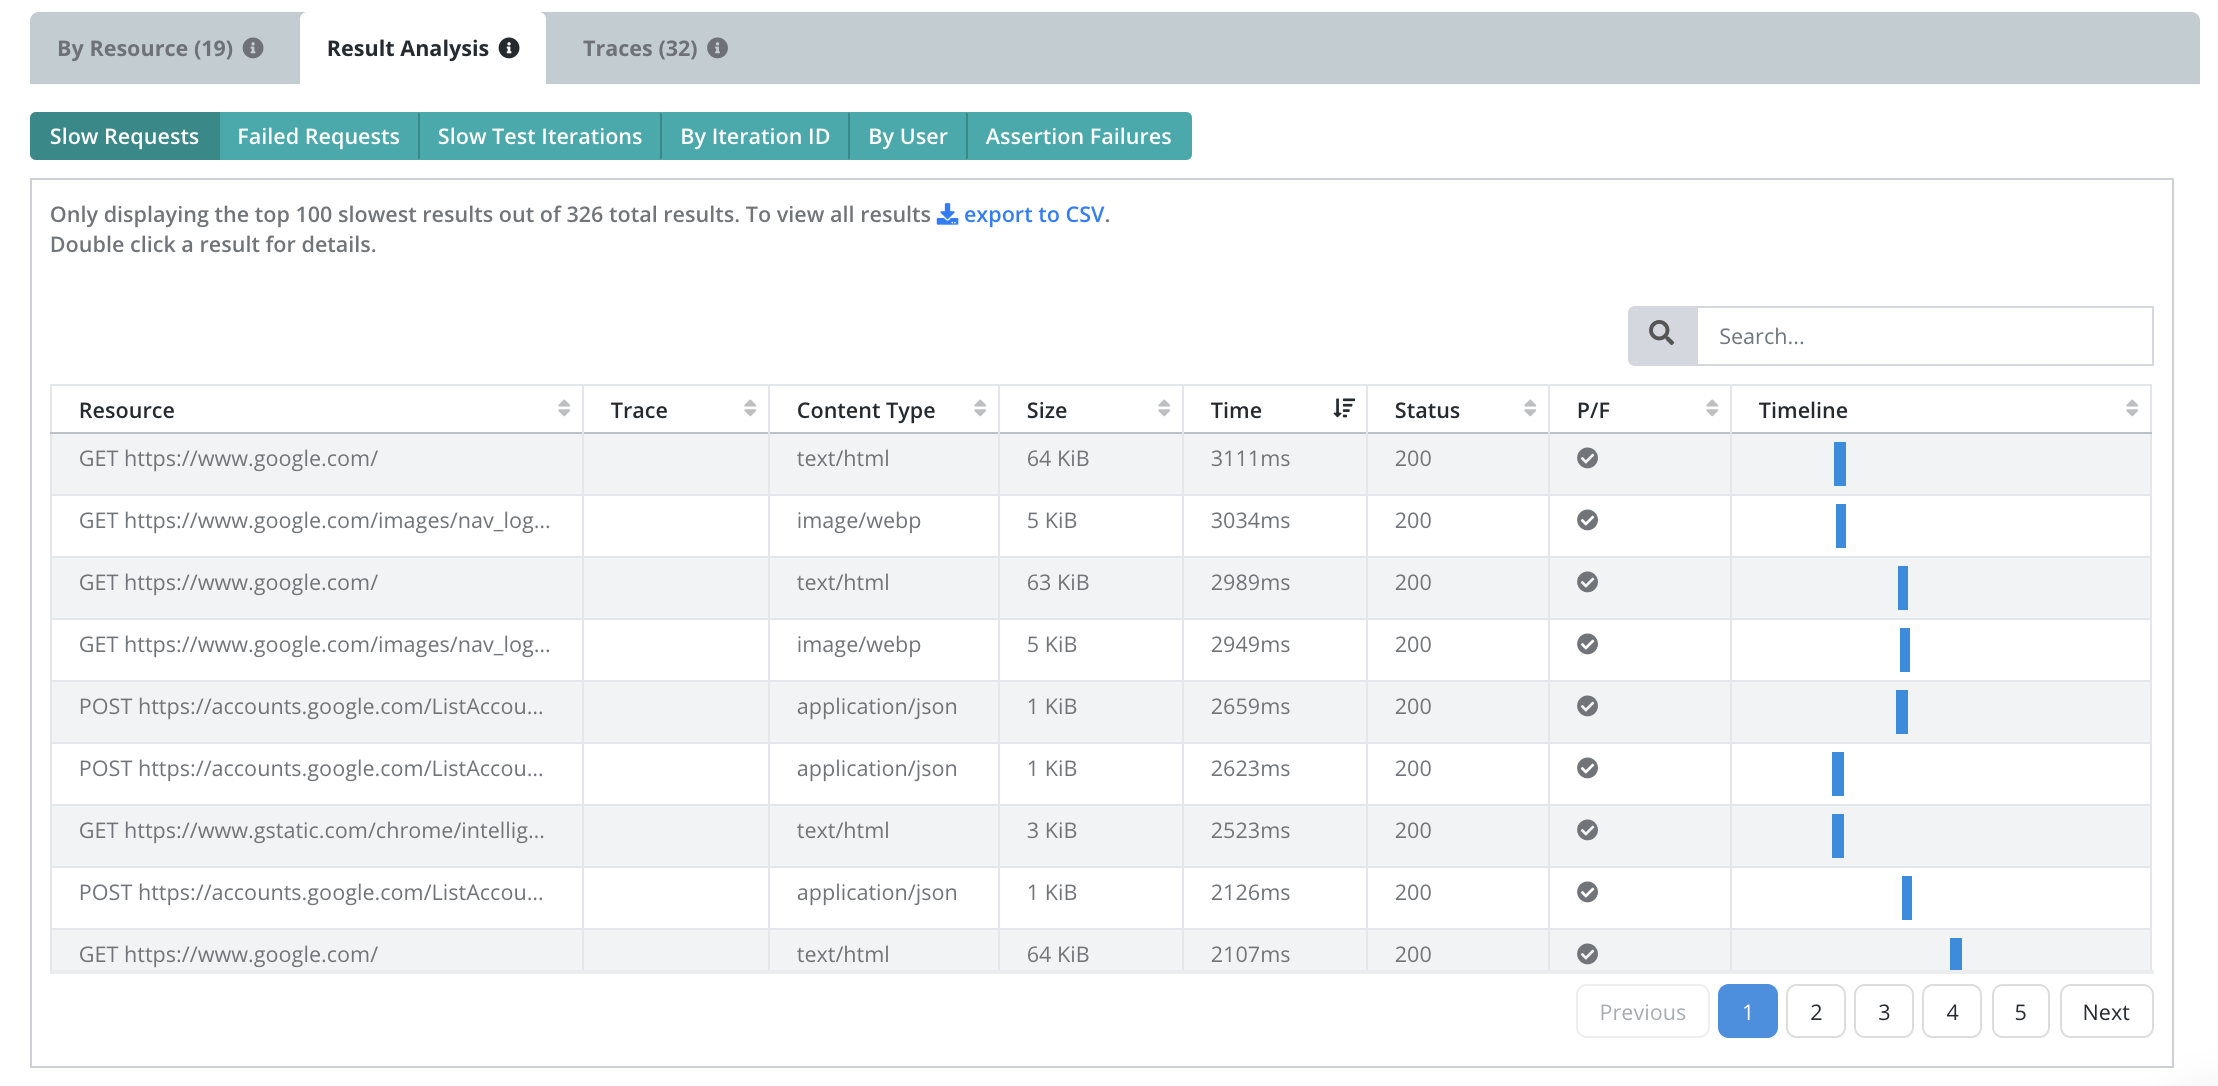
Analyze the results of individual network requests to get a deep dive into any issues. See the slowest results, failed results, the slowest iterations, all results that were a part of a particular iteration of your scenario, results by user, and all iterations of the test where there was an assertion failure. You can also simply export all results to CSV to analyze further offline.
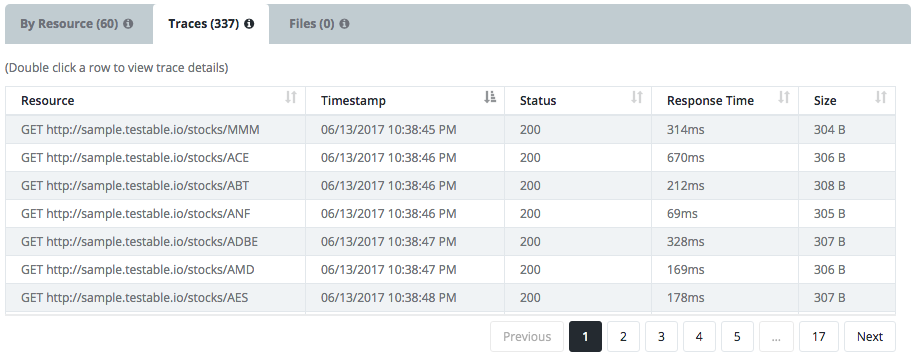
Traces allow you to view all the details of a particular connection made during test execution including metrics, data sent, and data received.
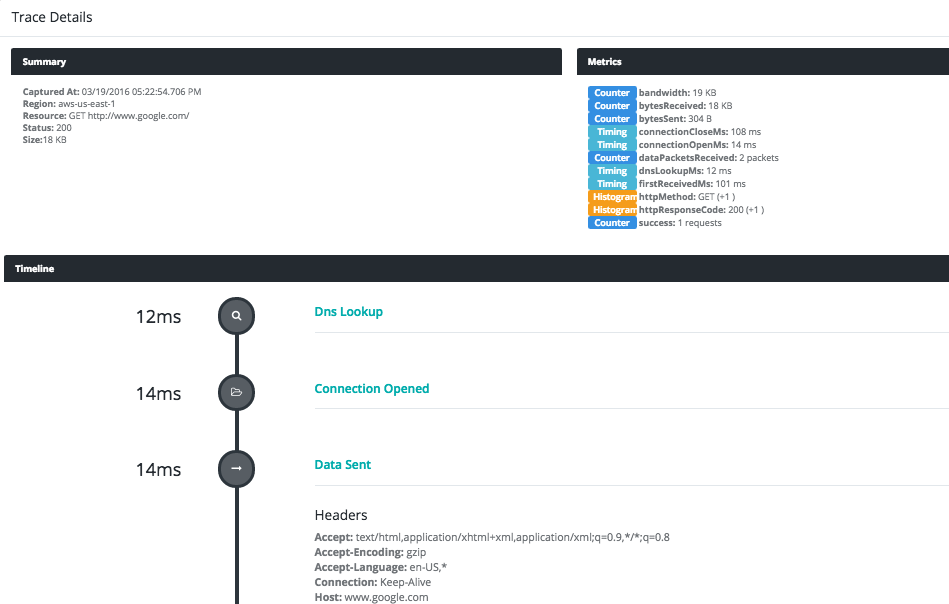
Example Trace
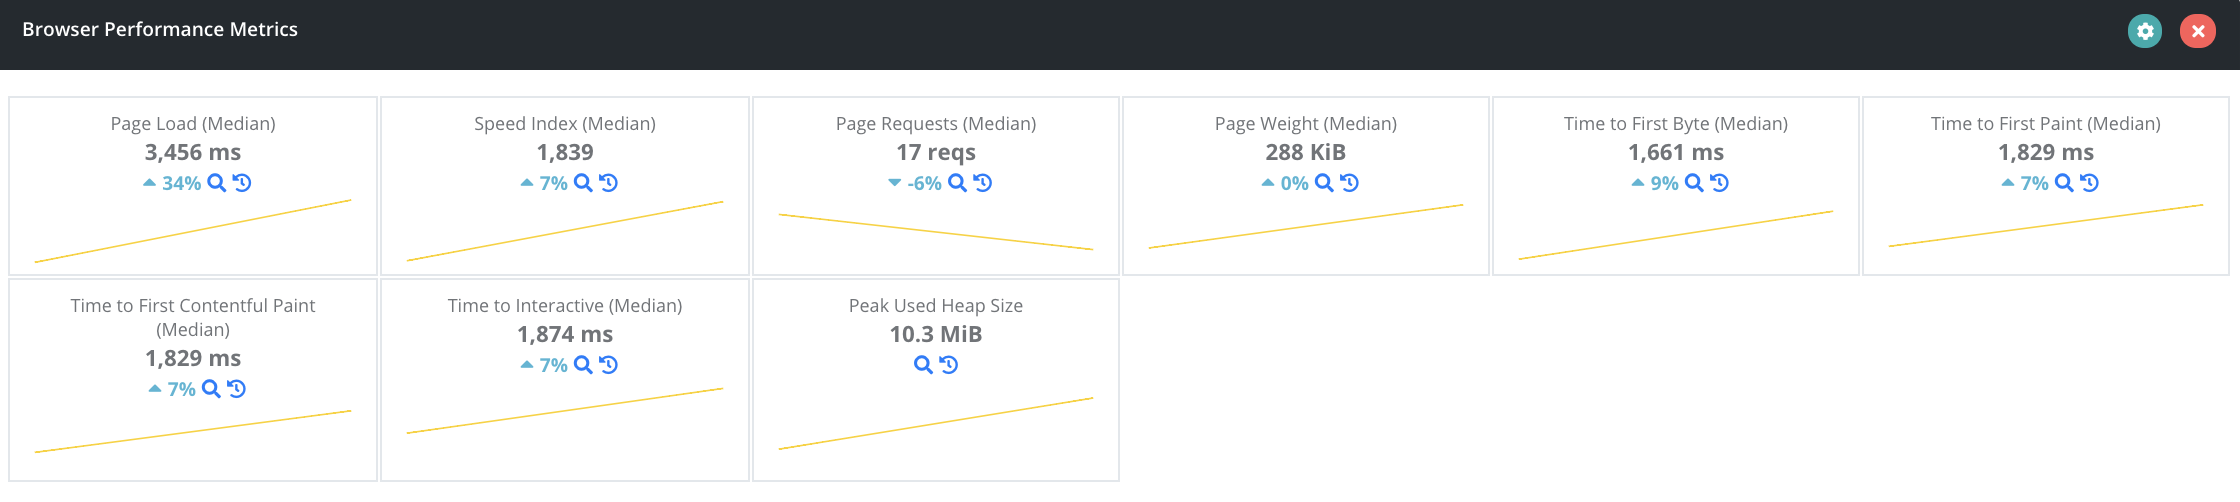
Additional Charts/Metrics
Any metric can be charted or displayed. Data points are captured every 10 seconds. Like everything else charts are customizable. For example, for Selenium tests we show a “Browser Performance Metrics widget”:
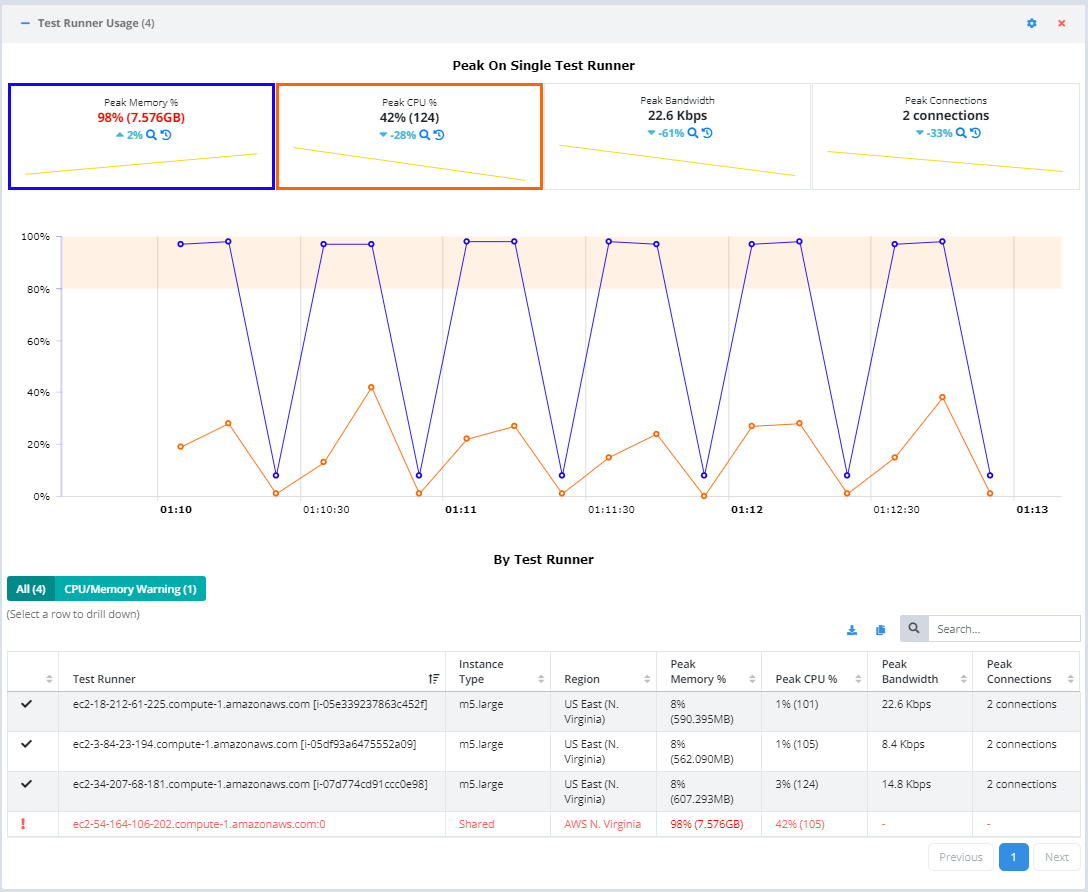
Test Runner Usage
View details of memory, CPU, and bandwidth utilization across the test runners as well as broken down by test runner. Select a test runner in the grid to make the metrics and chart drill down to that test runner only.
Logging Tab
The logging widget shows all logging captured during execution, both system and scenario generated.
Logging can be viewed in tail mode to see the most recent log entries at the top.
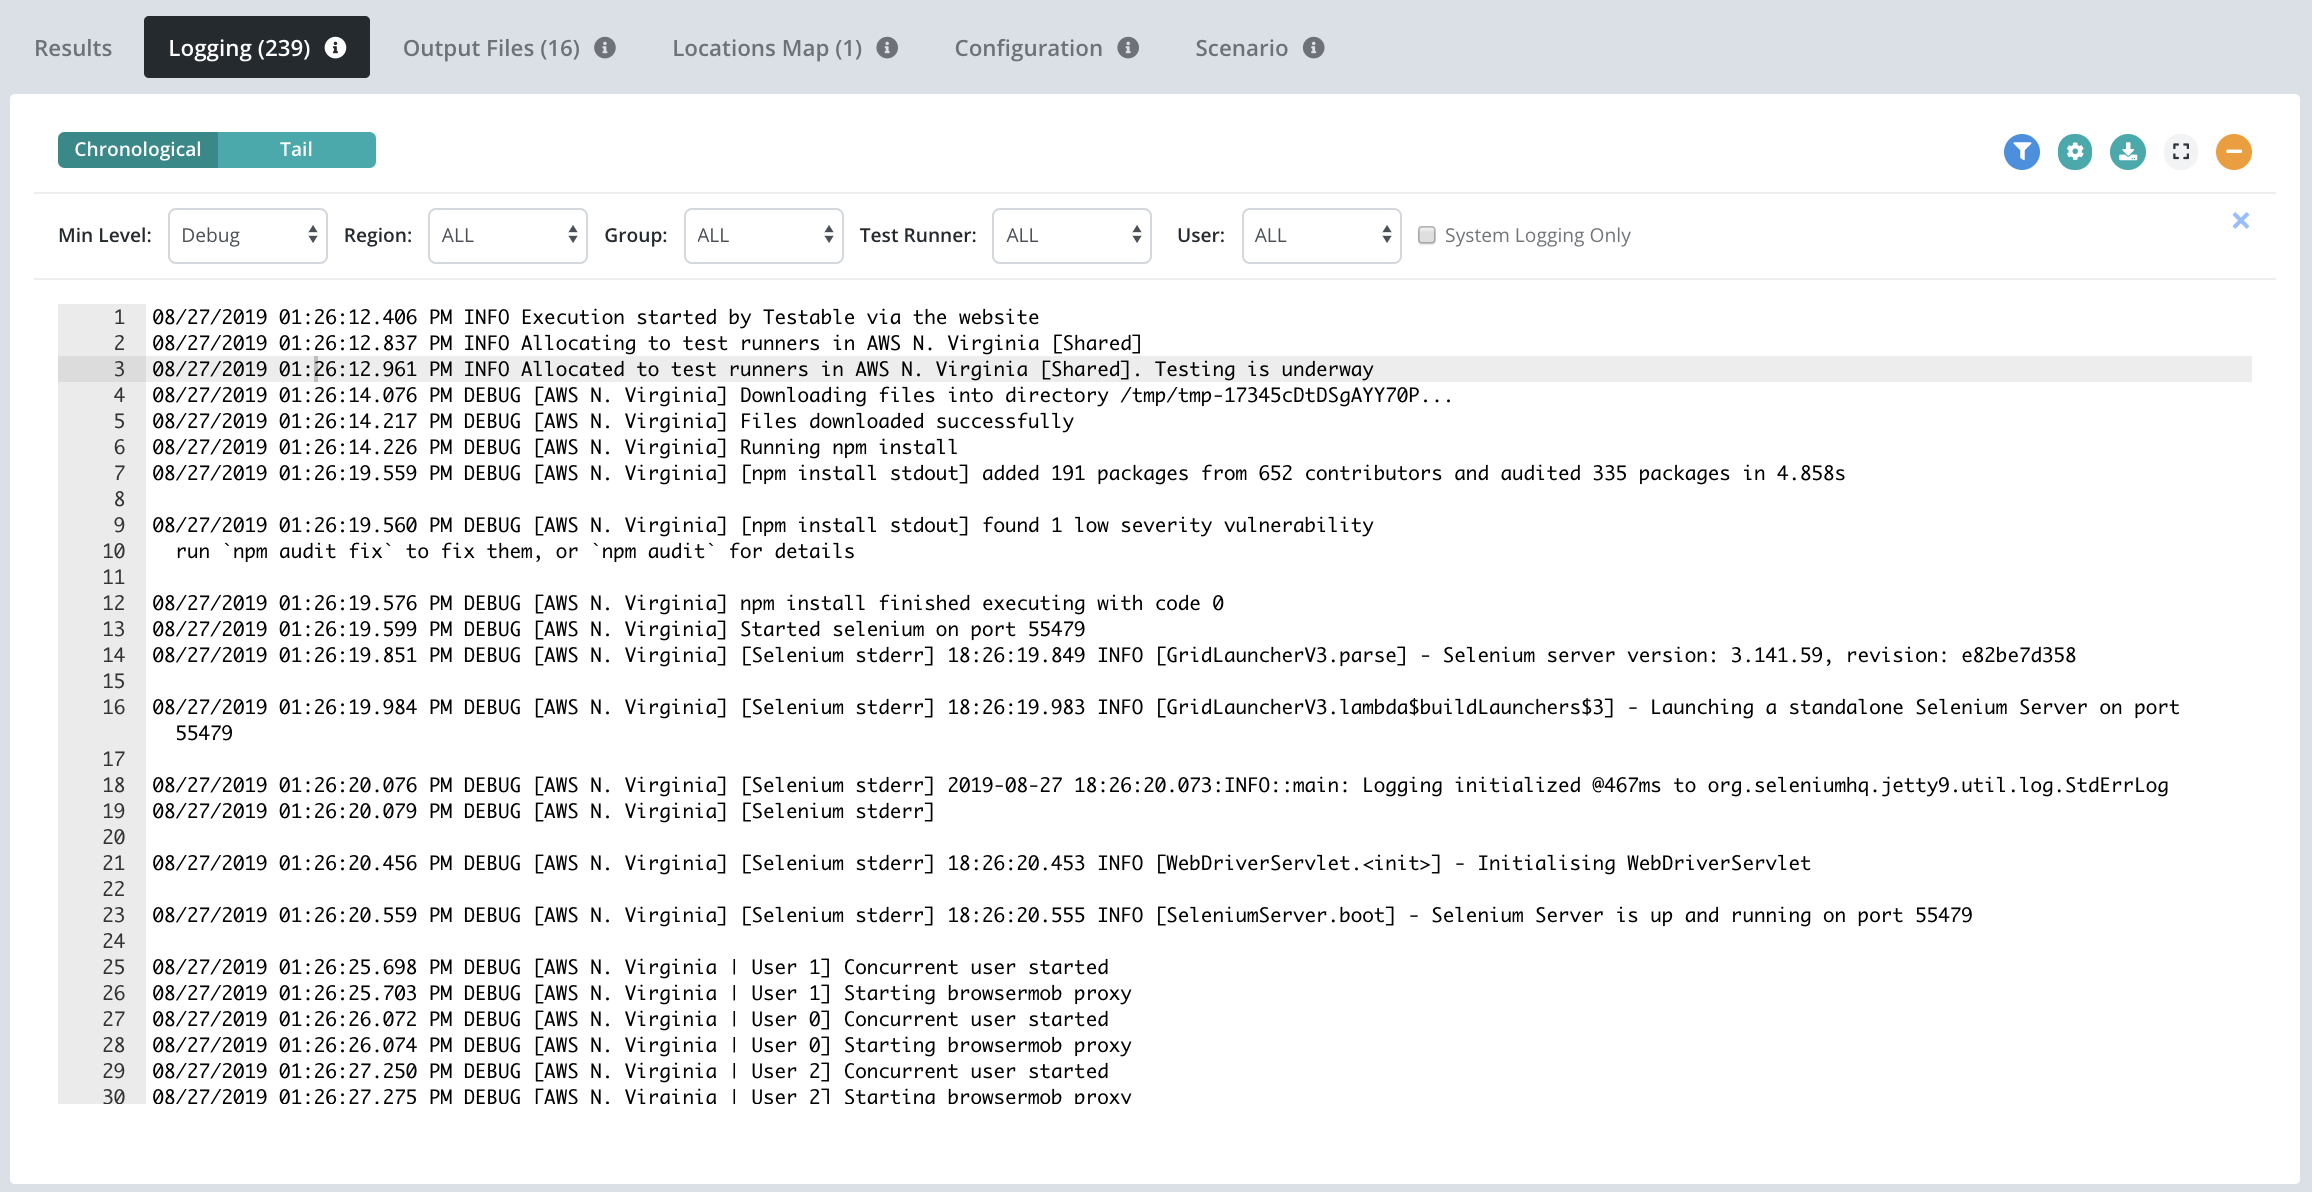
Filters can be applied to narrow down the logging displayed by using the various filter controls across the top.
Output Files Tab
If you scenario captures output files (e.g. screenshots), these will be available on the Files tab. To capture only a sampling of the output files from your test, update Edit Configuration action => Advanced Options => Capture All Output by unchecking it. The method by which to capture output files is scenario type specific. See the documentation for the specific scenario type for more details (e.g. Selenium, PhantomJS, etc).
Locations Tab
The locations map shows where the test runners utilized to execute your test are located around the globe. If you hover over any region you can see the peak memory and CPU utilization across all the test runners within that region.

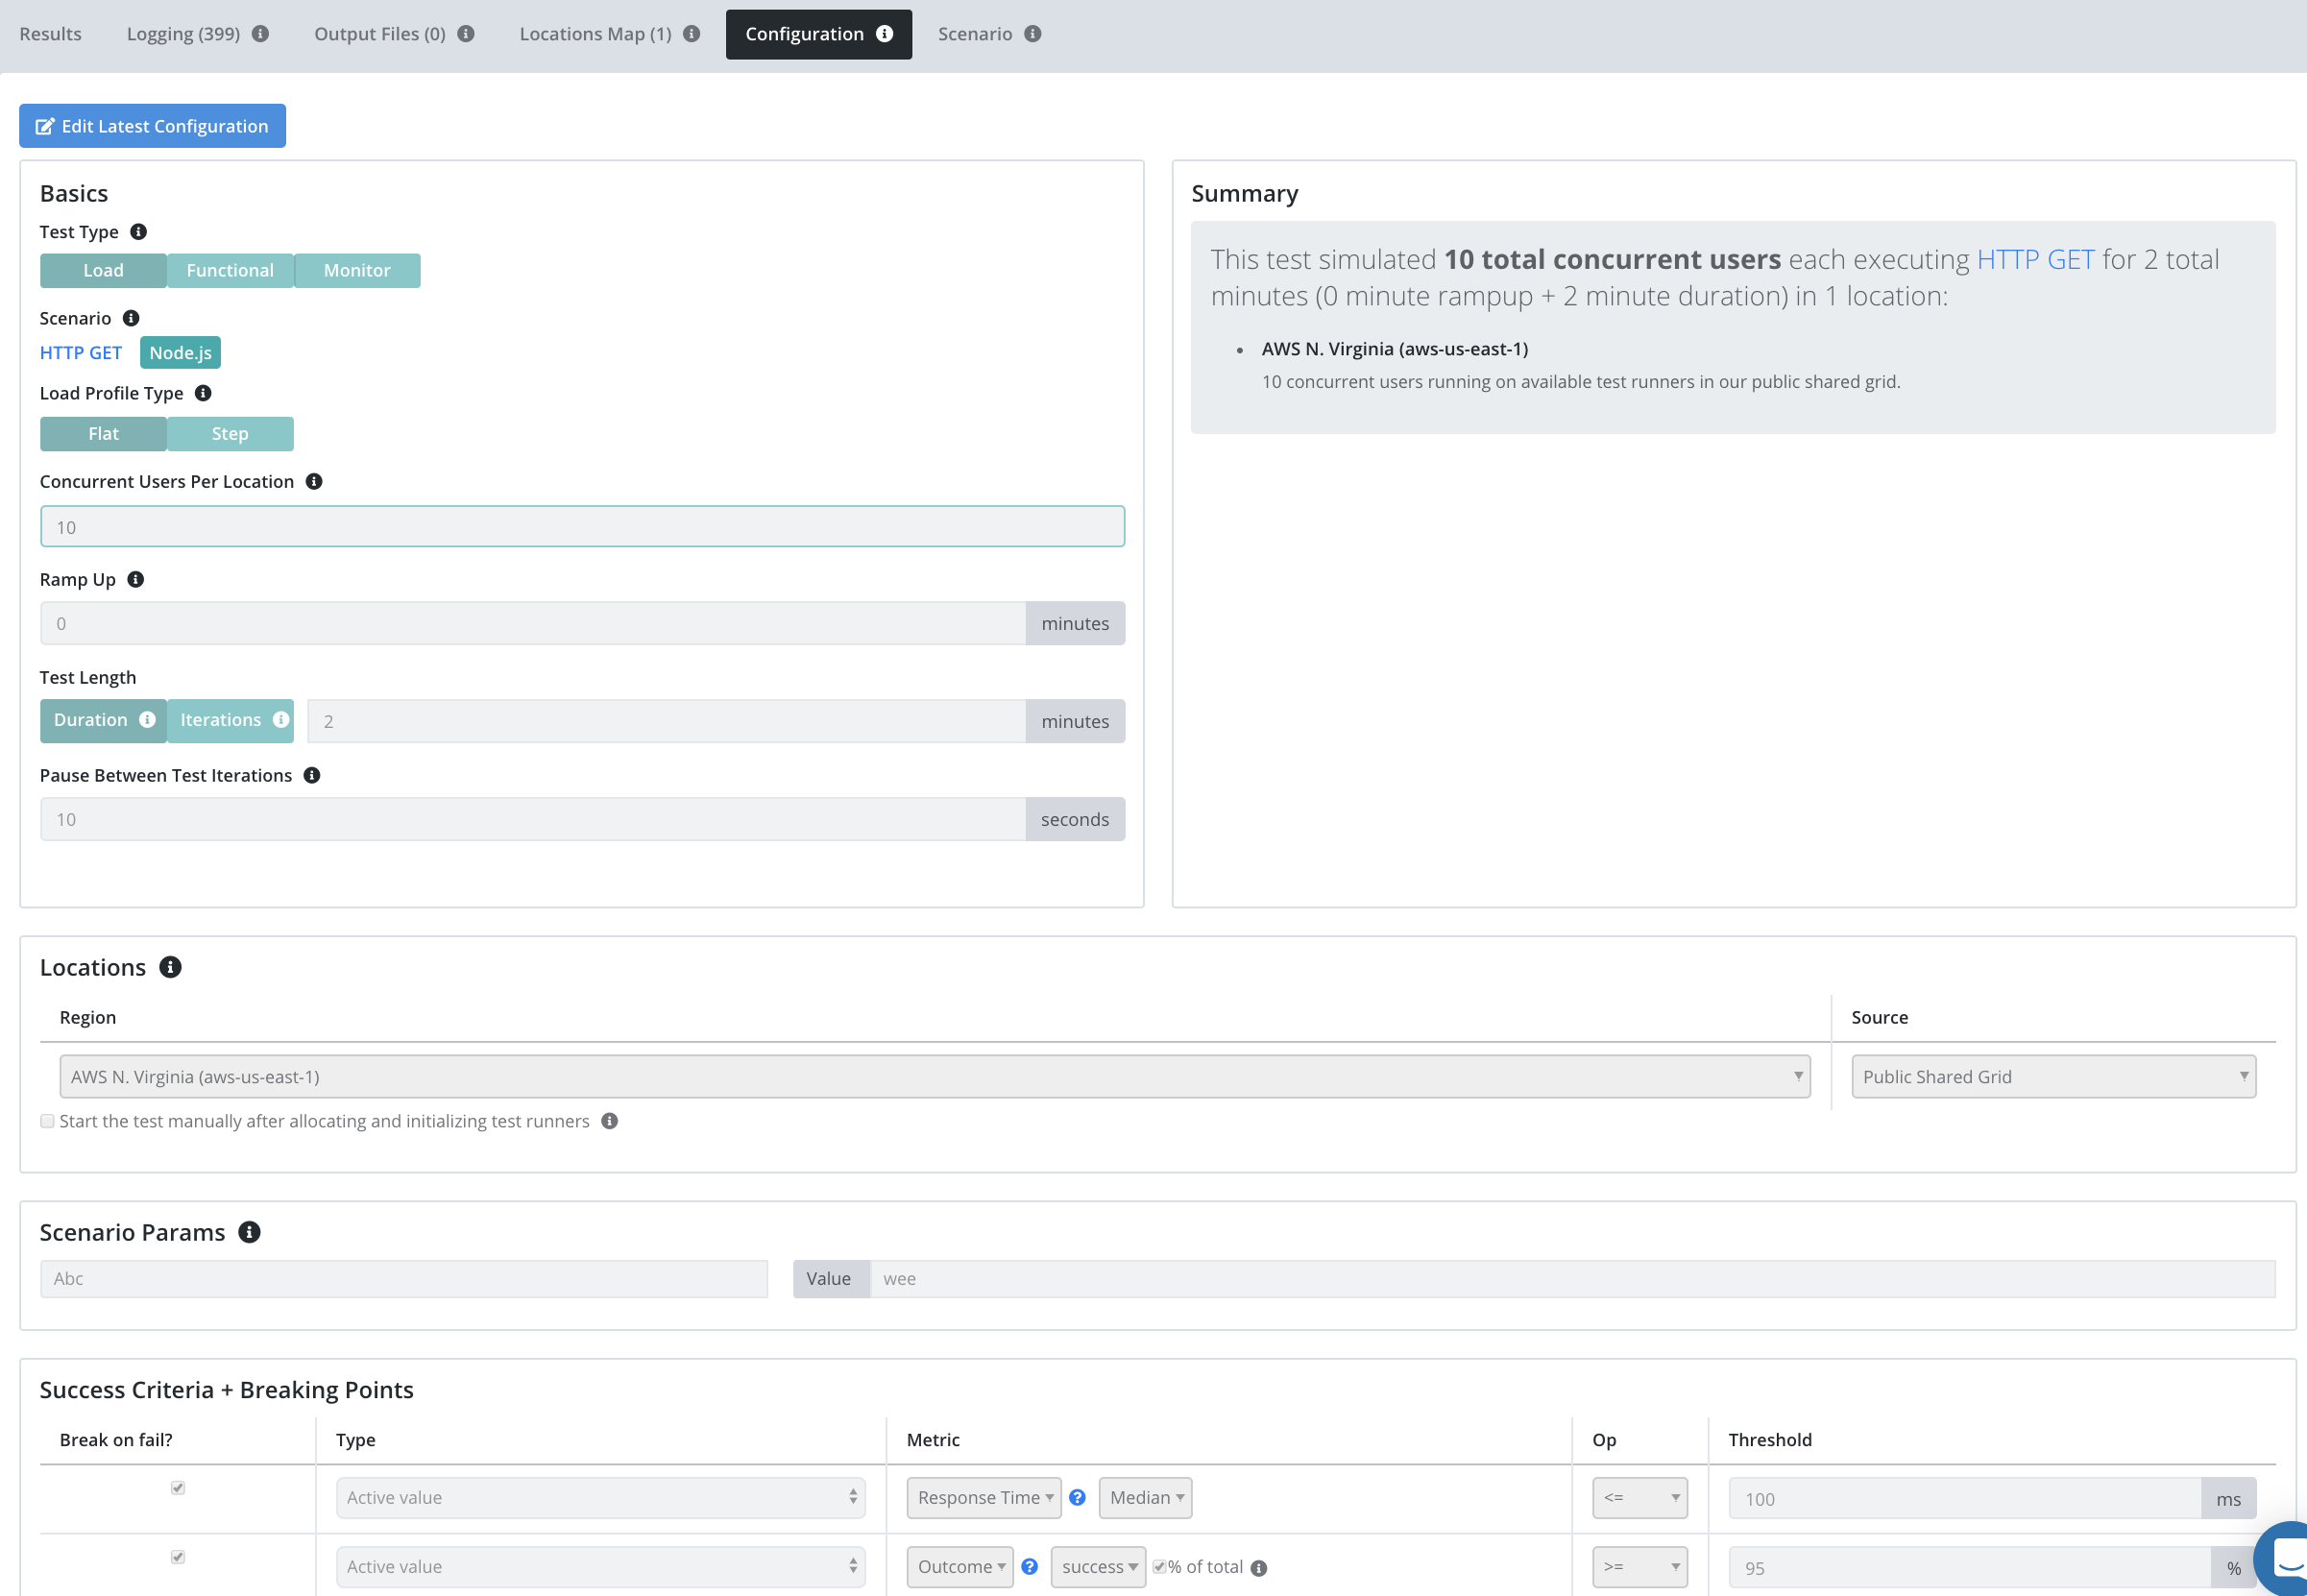
Configuration Tab
See the exact test configuration that was used when running this test.
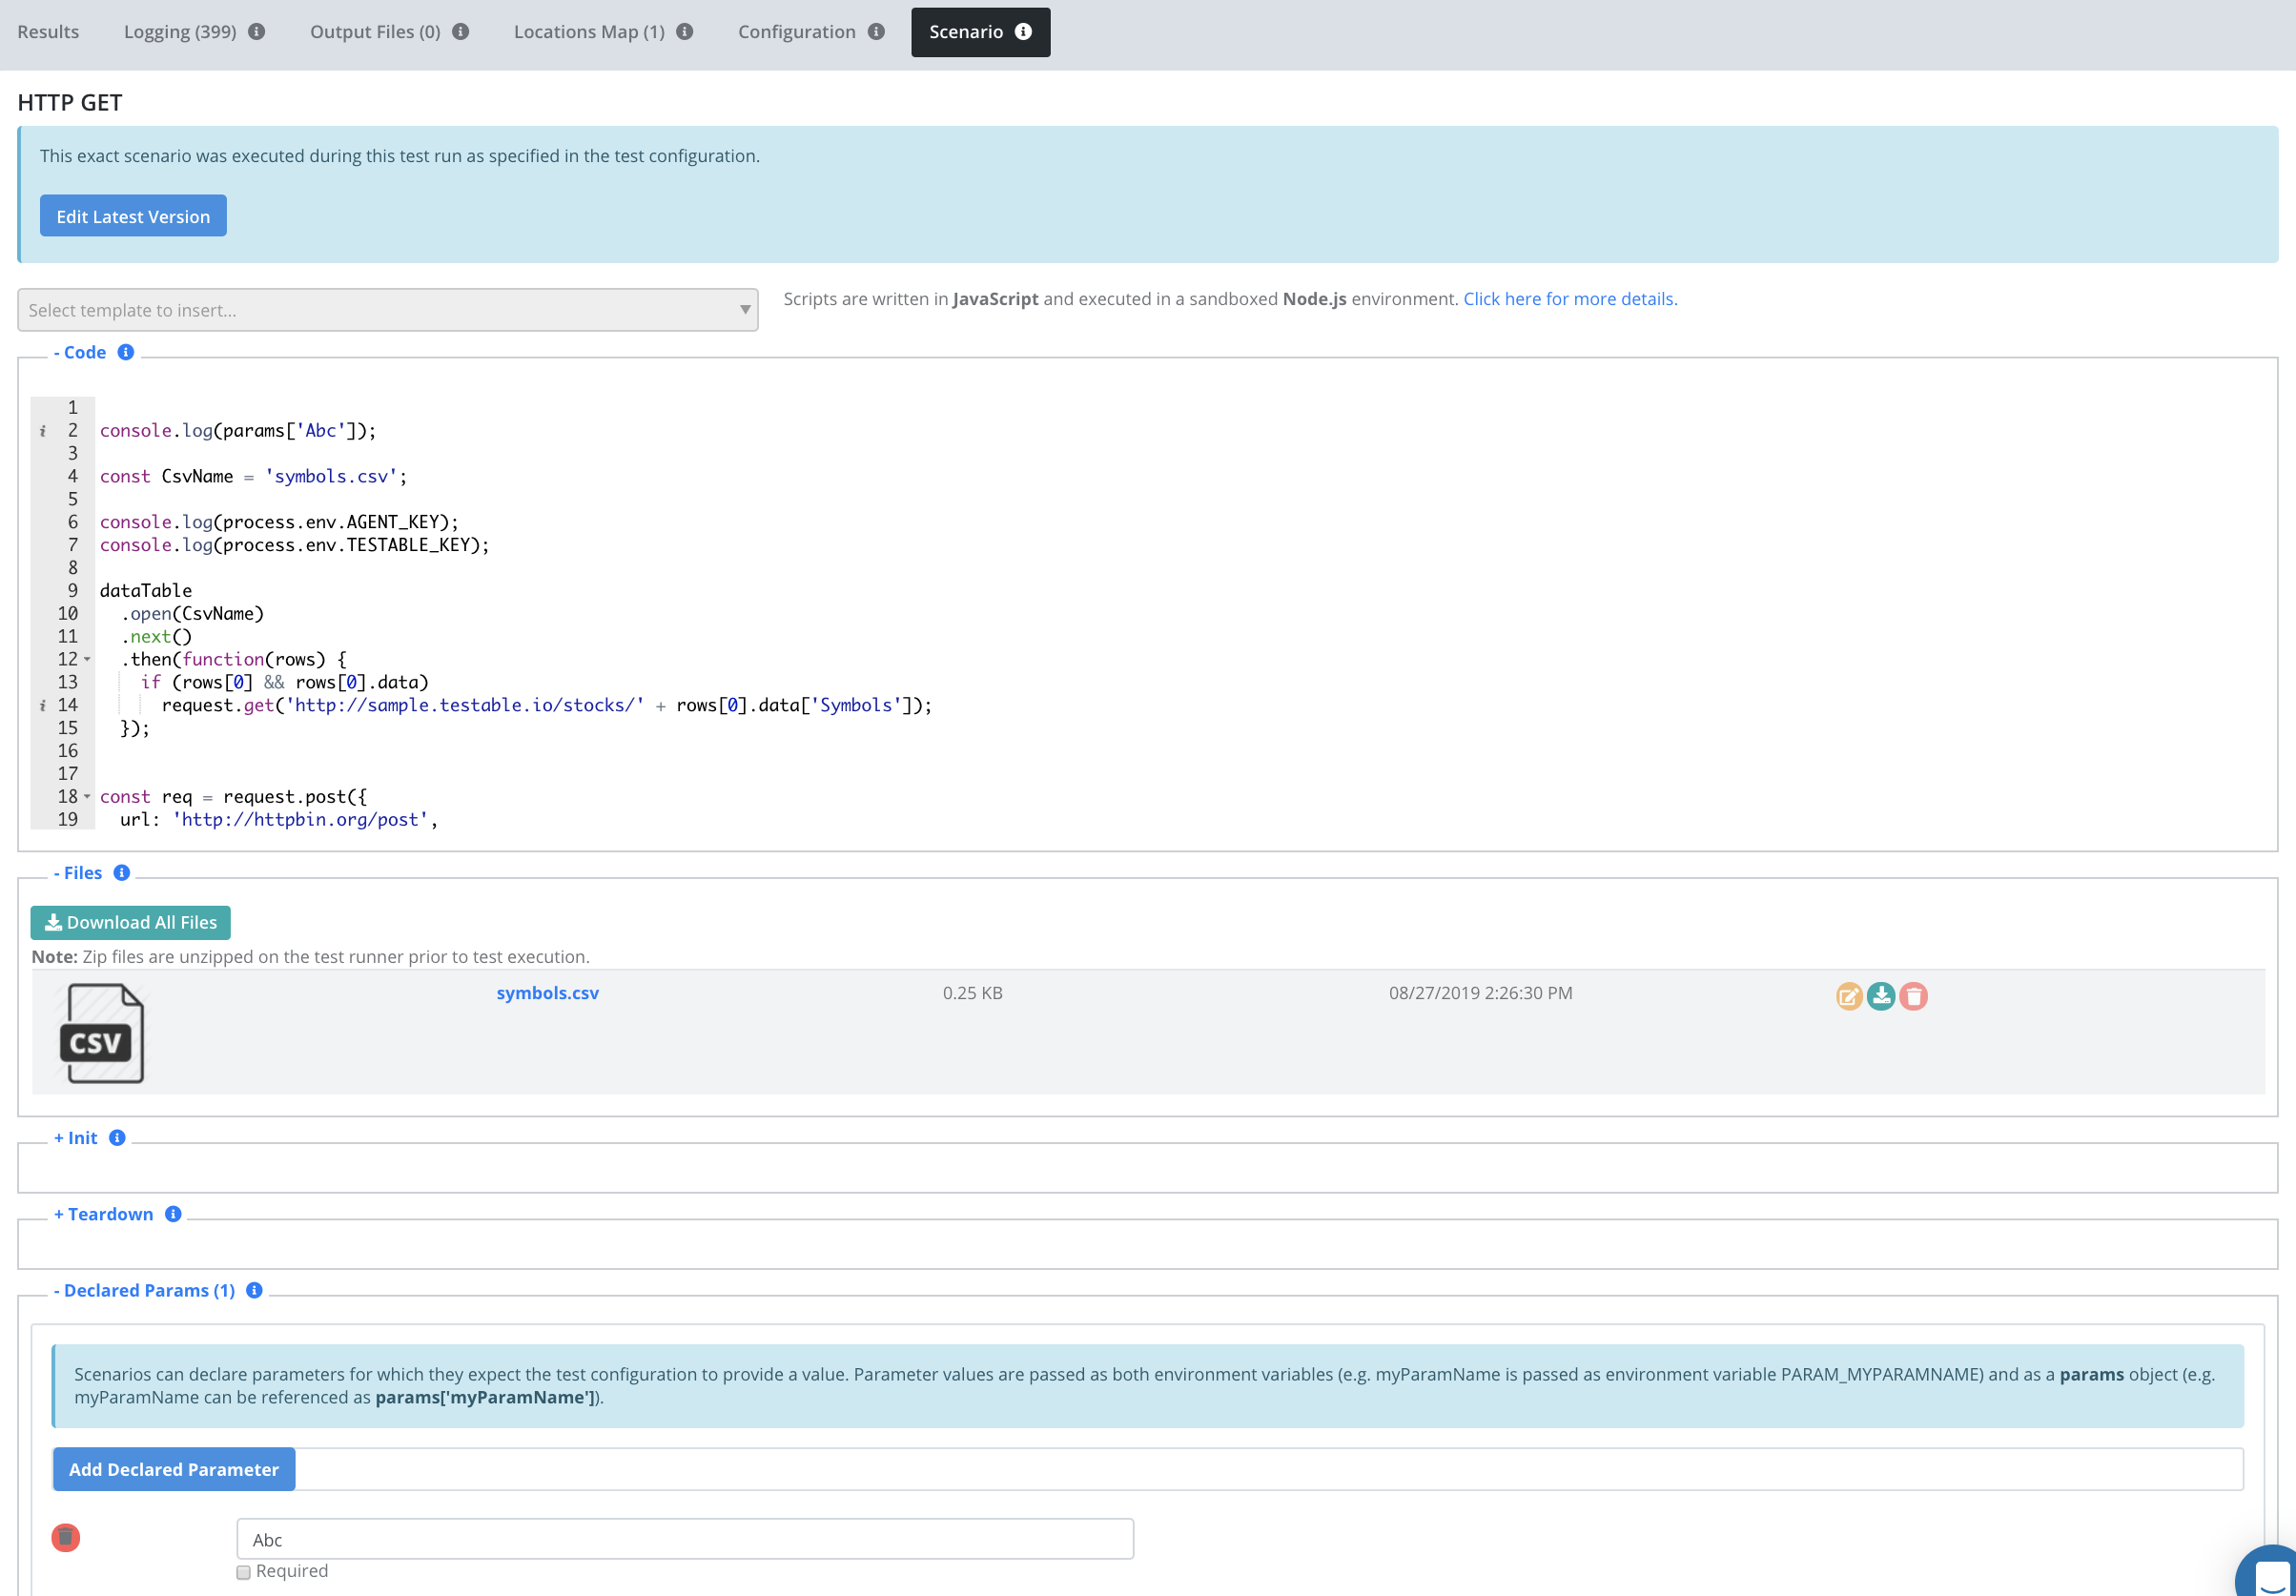
Scenario Tab
See the exact scenario (including uploaded files, code, scripts, settings, etc) that was used when running this test.