Create a Test Configuration
Getting Started
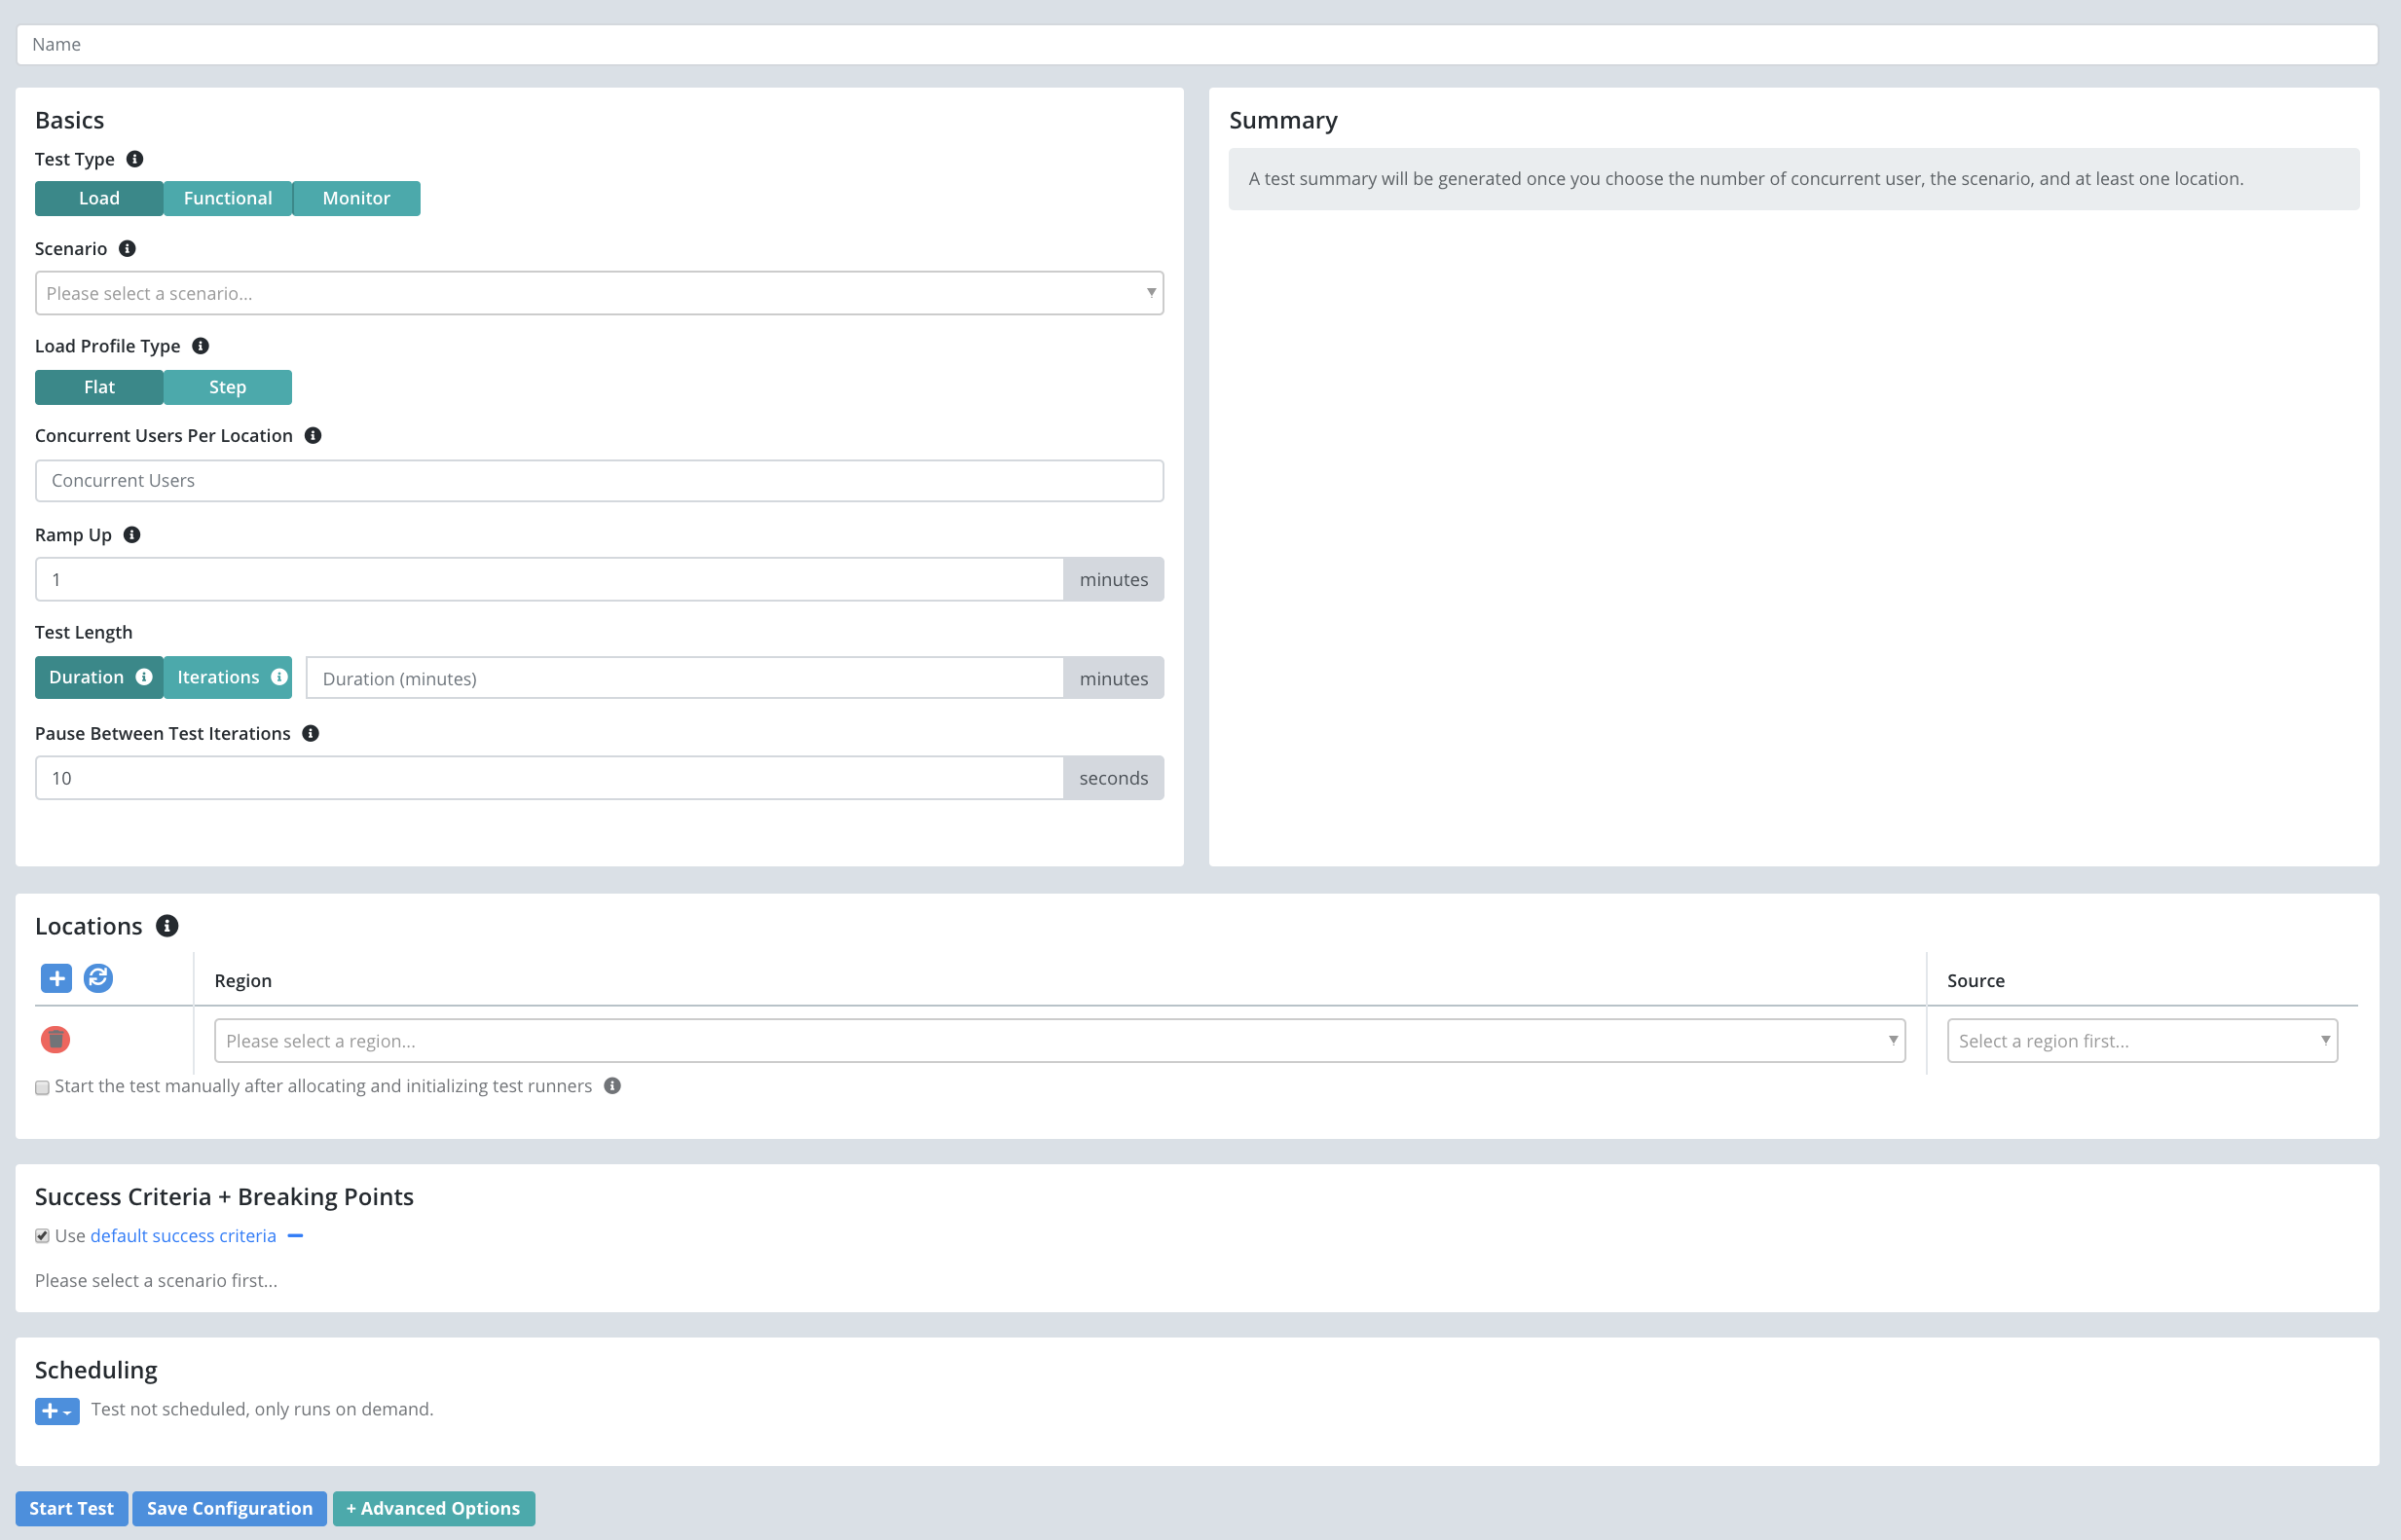
A test configuration define the load parameters that specify which scenario to run and how much load to generate (i.e. concurrent users, regions, duration, etc).
To create a new test configuration first Create a Test Case and define your test scenario.
Click on the new test case name on the left and it should take you to the ‘Test Configurations’ tab. Any existing configurations will appear with some basic information from the last time it was executed (if any). Feel free to rename, stop, or delete them from here.
To create a new configuration simply press the New Configuration button. This is also available from any scenario definition.
Parameters
-
Scenario: Choose which scenario to execute.
- Test Type: Which type of test you are configuring will affect the other parameters we prompt you for.
- Load: Simulate multiple virtual users at the same time.
- Functional: Run the scenario one time as one virtual user. Test results are optimized for this use case and avoid unnecessary aggregation that only makes sense for multi-user tests.
-
Monitor: Run a functional test on a recurring schedule as a way to monitor the health of an application.
- Load Profile (Load Test Only): The amount of load to generate and exactly what shape it takes. Not supported with JMeter, Gatling, and Locust scenarios where this can be accomplished inside the scenario definition. In those cases you only set the number of instances of the JMeter/Gatling/Locust to start in each location.
- Flat: Rampup to a constant number of Total Users for the duration of the test.
-
Step: Gradually increase the number of concurrent users in a step function. Specify the number of concurrent users to start, finish, and the step size. The steps will be evenly distributed across the duration of your test. 50 steps is the most allowed per location.
-
Test Length (Load Test Only): Select Iterations to have each client execute the scenario a set number of times regardless of how long it takes. Choose Duration if you want each client to continue executing the scenario for a set amount of time (in minutes). Not available for JMeter, Gatling, and Locust scenarios where this can be accomplished inside the scenario definition.
-
Pause Between Test Iterations (secs) (Load Test Only): Number of seconds to sleep between iterations of the scenario on each concurrent client. Minimum is 0 second, default is 10 seconds.
-
Locations: Choose the locations in which to run this test and the test runner source to use in each location (e.g. on our public shared grid). Test runners are the machines that actually run your simulation and report back results. If you choose to spin up test runners on demand from your own AWS account you can also choose the VPC, subnet, and key pair per location.
-
Test Runners: If one of your locations is using an AWS or Azure or GCP On Demand test runner source then this section will appear to allow you to configure the EC2 instance type and number of EC2 instances to spin up for your test. By default an automatic recommendation is made. If you switch to Manual mode you can configure the instance type and # of instances. You set the # of instances by specifying how many concurrent users or JMeter/Gatling/Locust processes you would like to run on each EC2 instance Testable spins up.
-
Success Criteria + Breaking Points: A set of KPIs that define what you consider a successful test. By default the criteria are only evaluated at the end of the test run. If you check the “Break on fail” checkbox for any of the criteria they will be evaluated in real-time as the test runs. If break on fail criteria is no longer met the test is stopped immediately. All conditions must pass in order for the test to be considered a success. Default success criteria are defined per scenario type under Org Management => Settings. These criteria can be updated and are used by default, but can also be overridden per test configuration. Criteria can be set on any metric including custom ones.
-
Scenario Params: If your scenario defines parameters their values are specified per test configuration. These parameters are passed to your scenario as environment variables, system properties, or a params object depending on the type of scenario.
- Schedule: Test configurations can be run on demand at any time. Scheduling a test is an optional additional way of running a test.
- Later: Run once at a later point in time.
- Recurruing: Define a regular schedule to run your test: monthly, weekly, daily, hourly, etc.
Advanced Parameters
-
Notifications: Whether or not to send an email notification. Can be configured to send only when the test fails or anytime the test completes. Default notification settings are defined under Org Management => Settings.
- Network Related: Settings related to how network requests are executed.
- Network Emulation: Choose a particular network type to emulate including various types of mobile networks (2G, 3G, LTE, etc) or a custom configuration. The limits set here are applied per concurrent user and automatically adjusted as your test starts/stops users. It even works with tools like JMeter, Gatling, and Locust where if 100 users are started by one process, each user/thread will get these limits.
-
Host Resolution: Override the local hosts file on each test runner and/or set a host aliases file (Linux only).
- Advanced Settings: A variety of additional settings and flags related to test execution.
- Test Startup: Choose whether you want the test to start as soon as all test runners are ready (default) or manually at the push of a button or API call.
- Percentiles: Comma separated list of percentiles to calculate for all timing metrics. Defaults to 50, 95, 99. Example of a timing metric is
connectionOpenMs. No more than 10 percentiles can be calculated. The default percentile list can be configured under Org Management => Settings. - Capture All Output: Some scenario types support capturing screenshots and other output. By default this output is sampled in a similar fashion to traces.
- Traces Enabled: Enable or disable request tracing. By default Testable will sample some requests and capture all request and response headers/body. This is then made available in the results. Note: every single request has metrics capture (latency, bandwidth, custom metrics, etc). This only controls the tracing functionality.
-
Image Comparisons: Some scenario types support capturing screenshots. Those images can be automatically compared against previous test runs or a baseline image uploaded to the scenario definition. This can be useful for detecting anomolies. A percentage difference relative to the baseline is calculated for each image and reported in the results both as a metric (Image Diff) and alongside the image for analysis.
- Filters: Settings related to filtering network requests and results.
- Network Request Filters: Use this section to block certain network calls from being made during your test. For example if you wanted to block all requests to Google Analytics you might add
www.google-analytics.comto the blacklist.
Items on the blacklist can be hostnames (no wildcards), IP addresses, or IP ranges. Note that full URLs are not supported. Any network request that matches a blacklist entry will not be made unless it also matches a whitelist entry. For example to block all network requests except towww.mycompany.comyou would add0.0.0.0/0(i.e. everything) to the blacklist andwww.mycompany.comto the whitelist.
Note that any blocked network calls will show up as connection failures in the test results (e.g. CONNECT http://www.google-analytics.com .. success rate = 0%). To filter out the failed network calls from the test results you must also add the hostname to the result collection filter described below.
Default network request filters are defined under Org Management => Settings. - Result Collection Filters: Unlike network request filters these filters do not block the network call from being made, but does filter results from being collected in the test results. So if a test needs to download certain 3rd party resources to work but you do not want to clutter your results with these network calls, use result collection filters.
Uses a blacklist/whitelist approach but supports wildcards (e.g. *.mycompany.com) and matches on full URLs instead of hostnames or IPs. Any URL that matches a blacklist entry will not be collected as part of the test results unless it also matches a whitelist entry.
Default result collection filters are defined under Org Management => Settings.
Once you press the Start Test button the configuration will get created and the first execution will automatically start. The browser will be redirected to the execution results page where you can watch the results flow in real-time.