Getting Started - Protractor
Follow this guide for a basic example of running a test with Protractor, a framework for end-to-end Angularjs testing. For our example we will use a simple script that opens http://juliemr.github.io/protractor-demo/.
Start by signing up and creating a new test case using the Create Test button on the dashboard.
Enter the test case name (e.g. Protractor Demo) and press Next.
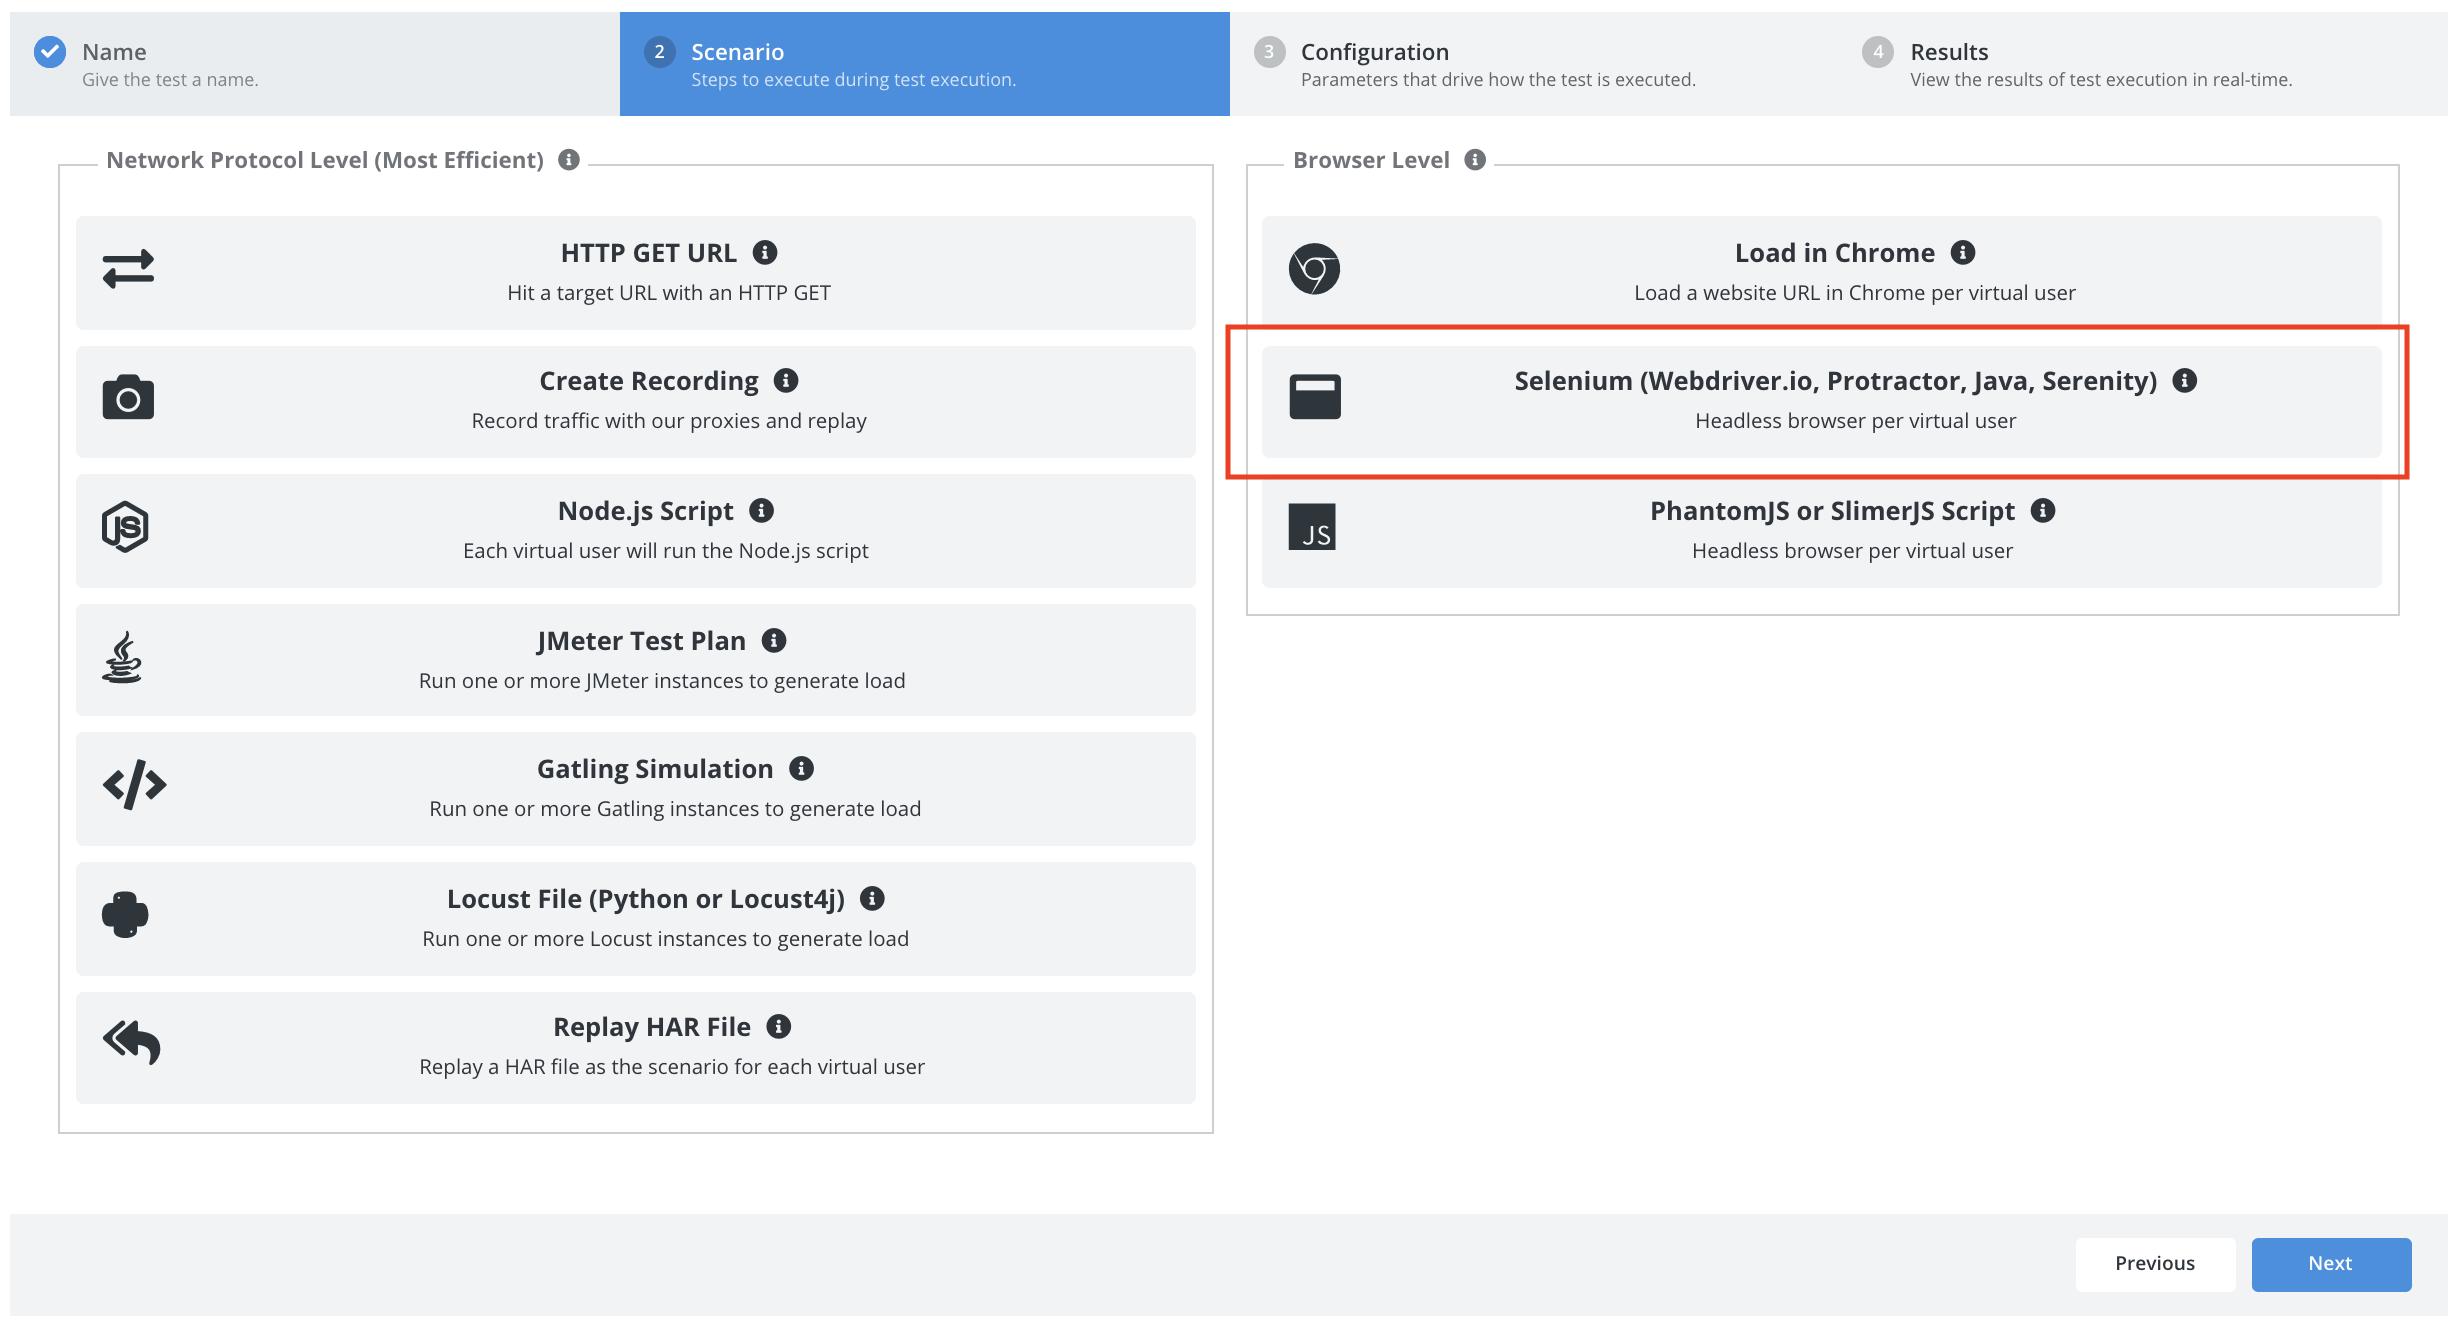
Scenario
Select Selenium as the scenario type.
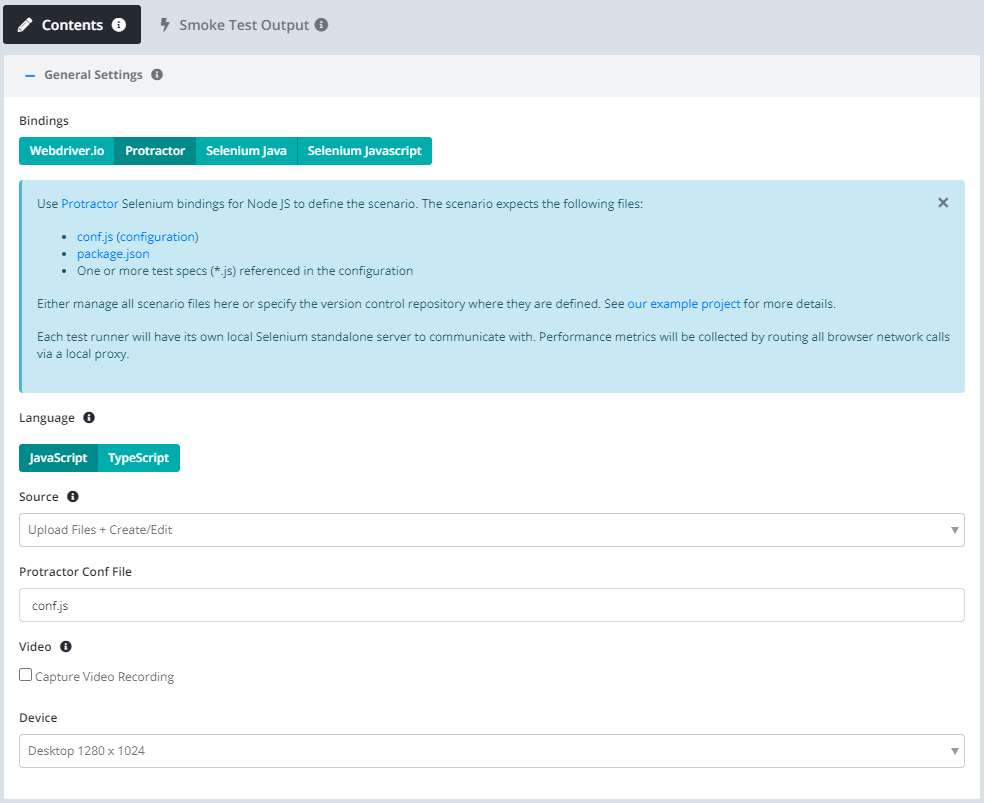
Let’s use the following settings:
- Bindings: Protractor.
- Source: Upload. We can also connect our scenario to version control, but for now let’s just create the files in the browser.
- Protractor Conf File: conf.js
Next press the Generate Example button to generate an example project that performs the test we want.
The Protractor executable requires a configuration file and a package.json file that controls which dependencies are required.
You can also find our example code at protractor-testable-example.
describe('Protractor Demo App', function() {
  it('should have a title', function() {
    browser.get('http://juliemr.github.io/protractor-demo/');
    expect(browser.getTitle()).toEqual('Super Calculator');
  });
});
Our basic example is pulled from the Protractor website.
To try it out before configuring a load test click the Smoke Test button in the upper right and watch Testable execute the scenario 1 time as 1 user.
Click on the Configuration tab or press the Next button at the bottom to move to the next step.
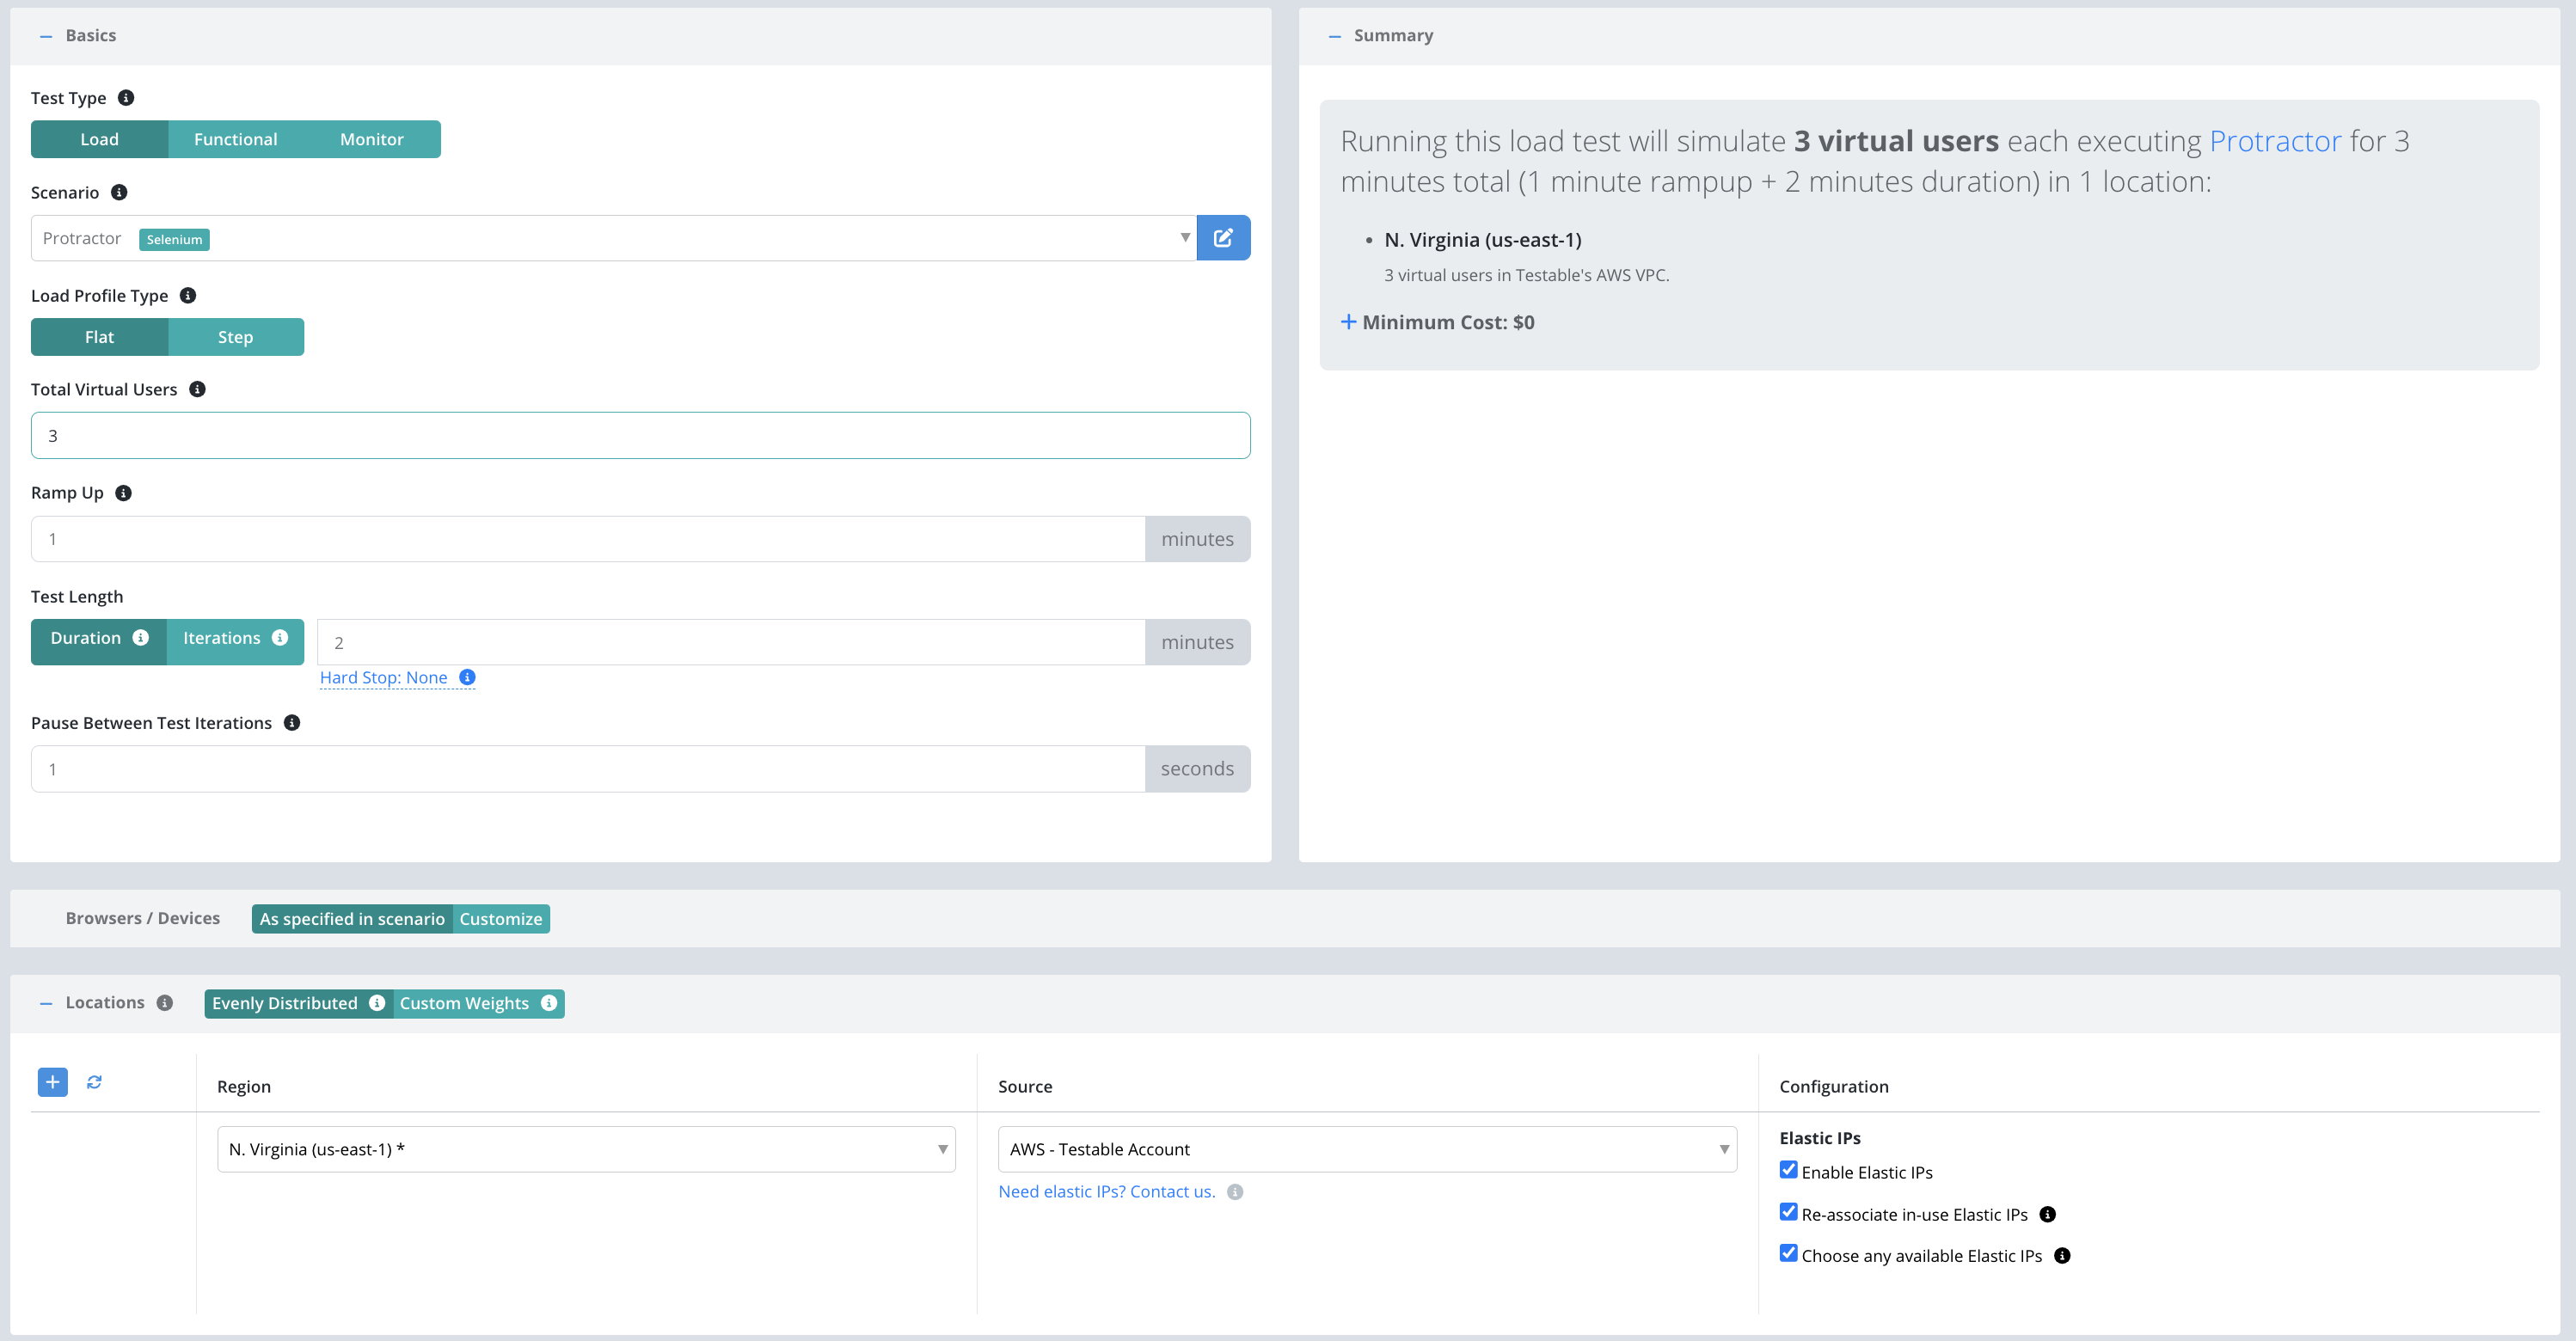
Configuration
Now that we have the scenario for our test case we need to define a few parameters before we can execute our test:
- Total Virtual Users: Number of users that will execute in parallel. Each user will execute the scenario.
- Test Length: Select Iterations to have each client execute the scenario a set number of times regardless of how long it takes. Choose Duration if you want each client to continue executing the scenario for a set amount of time (in minutes).
- Location(s): Choose the location in which to run your test and the test runner source that indicates which test runners to use in that location to run the load test (e.g. on the public shared grid).
And that’s it! Press Start Test and watch the results start to flow in. See the new configuration guide for full details of all configuration options.
For the sake of this example, let’s use the following parameters:
View Results
Once the test starts executing, Testable will distribute the work out to the selected test runners (e.g. Public Shared Grid in AWS N. Virginia).
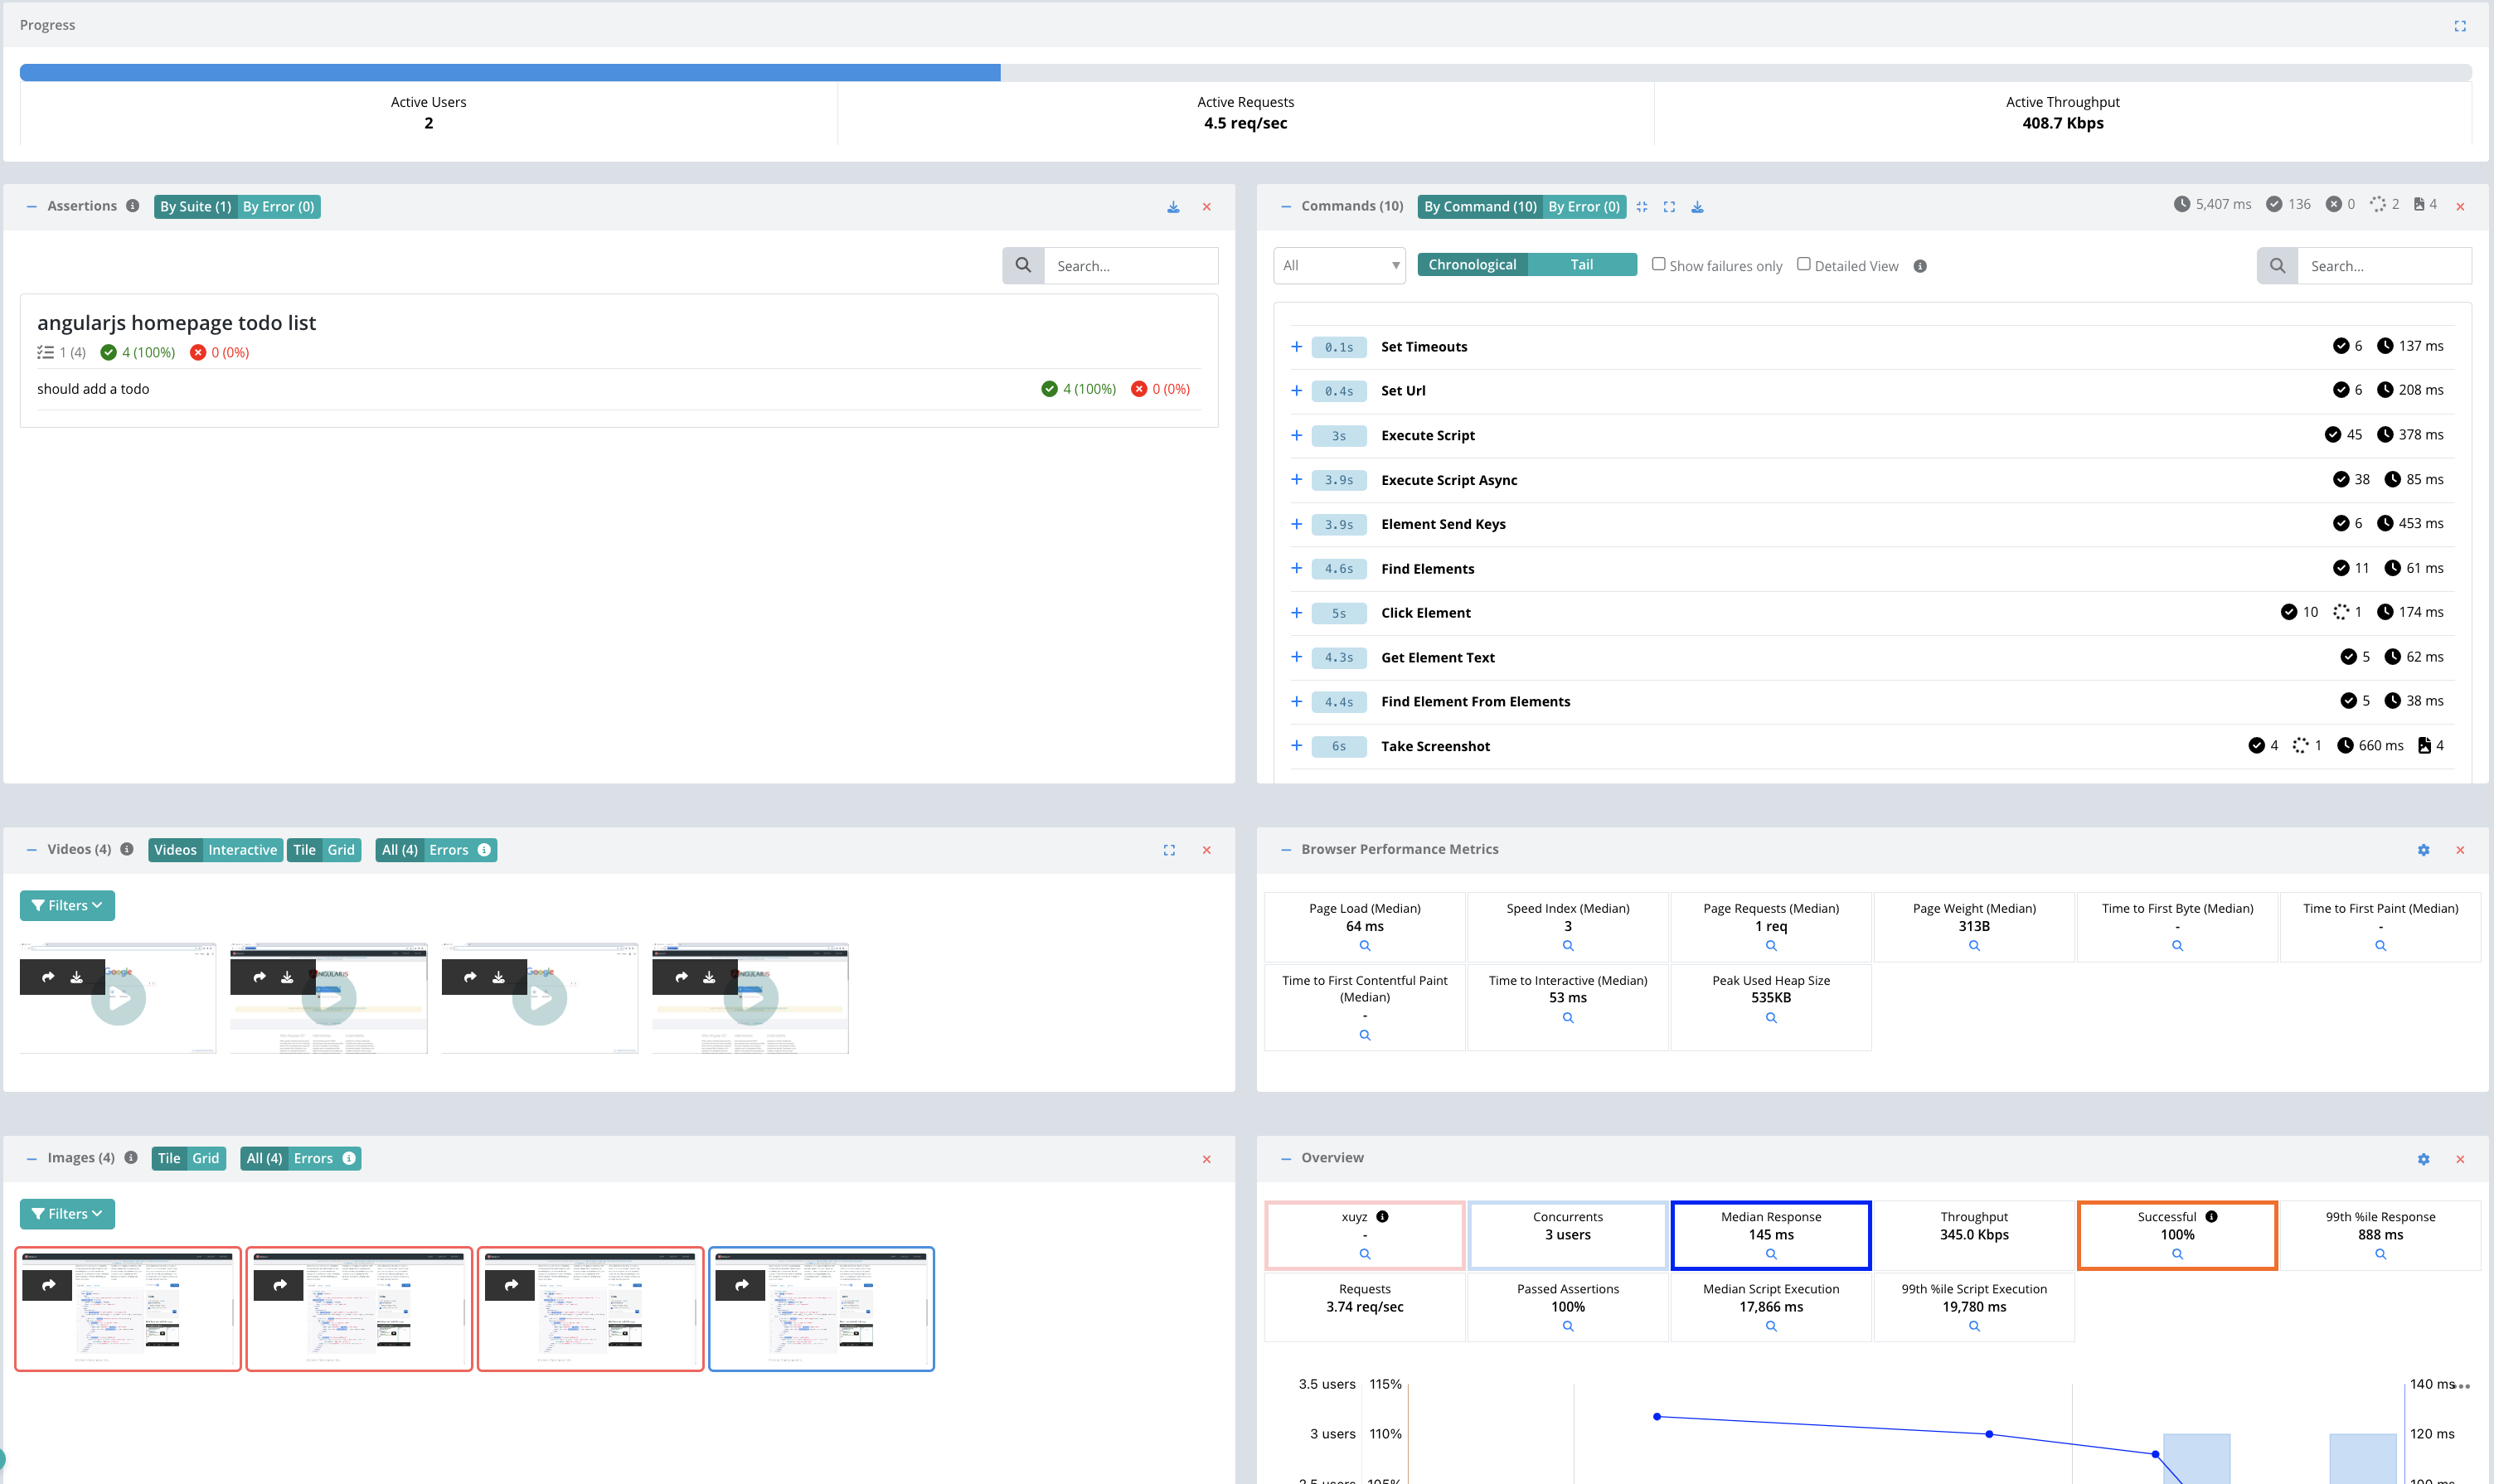
In each region, the test runners execute 3 concurrent Protractor tests (i.e. 3 virtual users) for 2 minutes. If the protractor test takes less than that, it will sleep for 1 second and then run the test again until more than 2 minutes has passed.
The results will include video, screenshots, assertions, traces, performance metrics, logging, breakdown by URL, analysis, comparison against previous test runs, and more.
Check out the Selenium guide for more details on running your Protractor scripts on the Testable platform.
We also offer integration (Org Management -> Integration) with third party tools like New Relic. If you enable integration you can do more in depth analytics on your results there as well.
That’s it! Go ahead and try these same steps with your own scripts and feel free to contact us with any questions.