Getting Started - Load URL
This guide provides the simplest possible setup of a load test. Start by signing up for an account and logging in if you have not already done so.
Define Target URL
After logging in you should see a Create Test button on the dashboard. Click on it to get started. There are four steps: Name, Scenario, Configuration, and Results. We will examine each step one by one below. Go ahead and give it a name like ‘Demo’ and click enter or Next.
Scenario
The scenario is the set of steps that will be executed during your test. In this test, we will load the google.com homepage in a Chrome browser so go ahead and choose Load in Chrome and then enter google.com as the URL.
Look at that, we’ve defined a scenario in a couple clicks! Now let’s turn it into a real load test. Click on the Configuration tab or press the Next button at the bottom.
Configuration
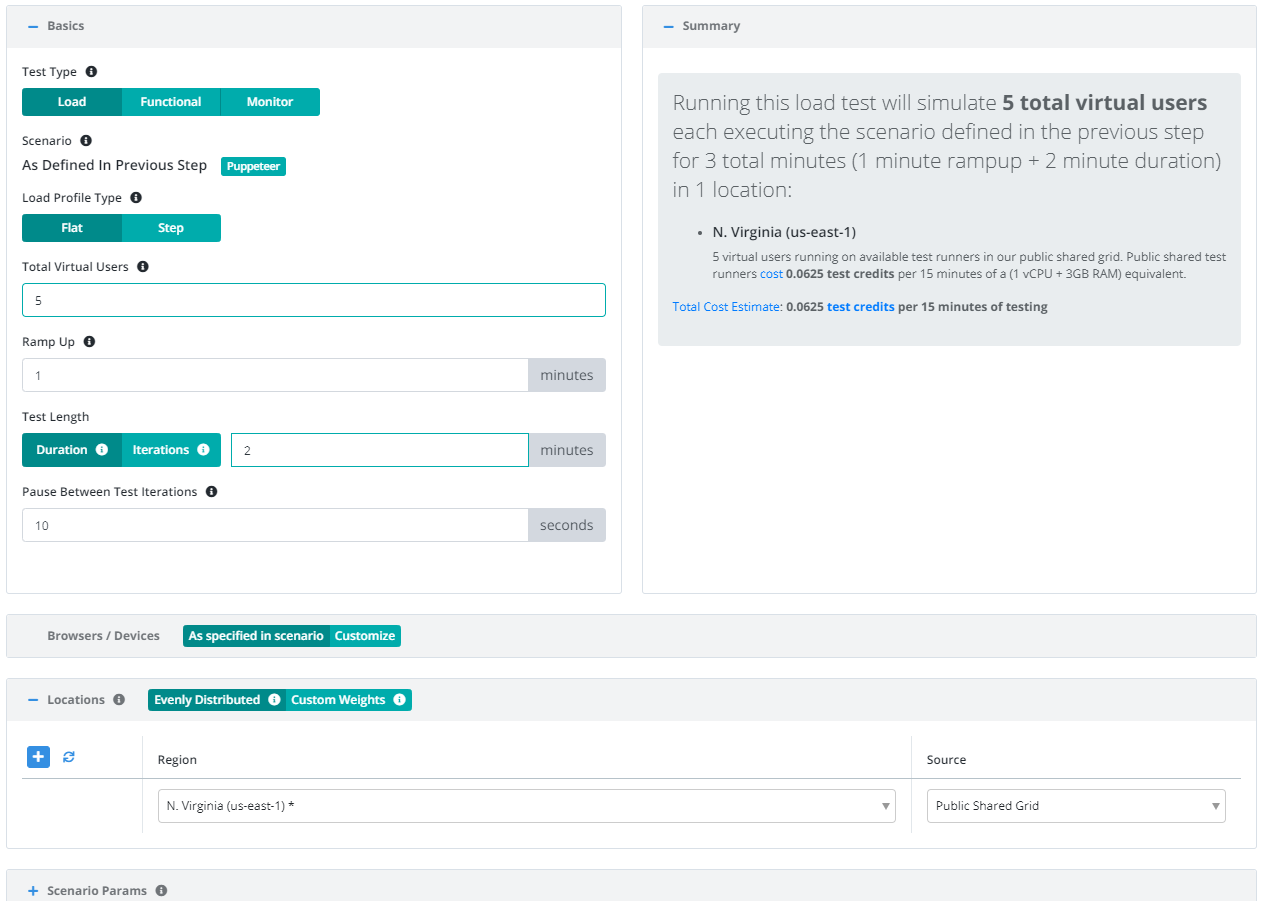
Now that we have the scenario for our test case we need to define a few parameters before we can execute our test:
- Total Virtual Users: Number of users that will execute in parallel. Each user will load the URL specified.
- Test Length: Select Iterations to have each client execute the scenario a set number of times regardless of how long it takes. Choose Duration if you want each client to continue executing the scenario for a set amount of time (in minutes).
- Location(s): Choose the location in which to run your test and the test runner source that indicates which test runners to use in that location to run the load test (e.g. on the public shared grid).
And that’s it! Press Start Test and watch the results start to flow in. See the new configuration guide for full details of all configuration options.
For the sake of this example, let’s use the following parameters:
View Results
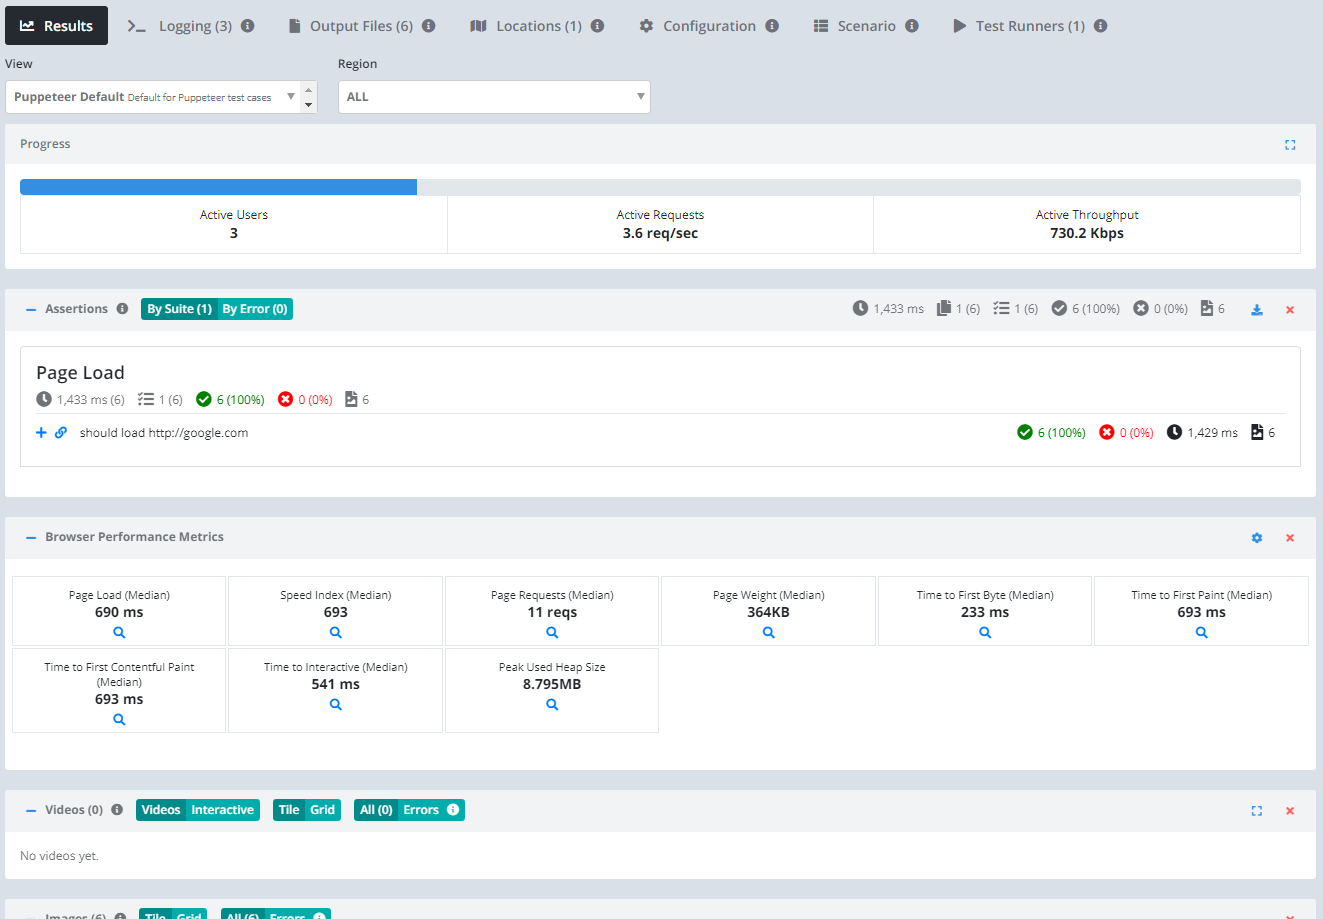
Once the test starts executing, Testable will distribute the work out to the selected test runners (e.g. Public Shared Grid in AWS N. Virginia).
In each region, the Testable test runners execute the recorded scenario (i.e. load google.com in Chrome) with 5 concurrent clients 20 times through. We can see from the results which resources were loaded in addition to google.com, how many times, latency, success rate, etc.
Below the resource result grid you can see various graphs. If you click on any resource in the grid, the charts below will update to be specific to that resource only.
We offer integration (Org Management -> Integration) with third party tools like New Relic. If you enable integration you can do more in depth analytics on your results there as well.
That’s it! Go ahead and try these same steps with your favorite website or API and feel free to contact us with any questions.